


- SUI gains over 8% on Monday, breaking above the $3 level.
- The total value locked (TVL) on the Sui blockchain climbed 5% in the past 24 hours, reaching $1.43 billion.
- Technical and on-chain indicators support a bullish outlook, positioning SUI for double-digit gains.
SUI, the native token of the Layer 1 blockchain, is rallying on Monday, attempting a break out of its downward trend that started on January 6. The token eyes further gains riding on bullish catalysts.
SUI gains likely with following catalysts
The total value of tokens locked (TVL) on SUI has climbed 5%, up to $1.43 billion, according to DeFiLlama data. SUI’s TVL has dropped from its January 7 peak of $2.065 billion, seen in the chart below.
A recovery in TVL implies an increase in investor confidence and demand for the token among traders.
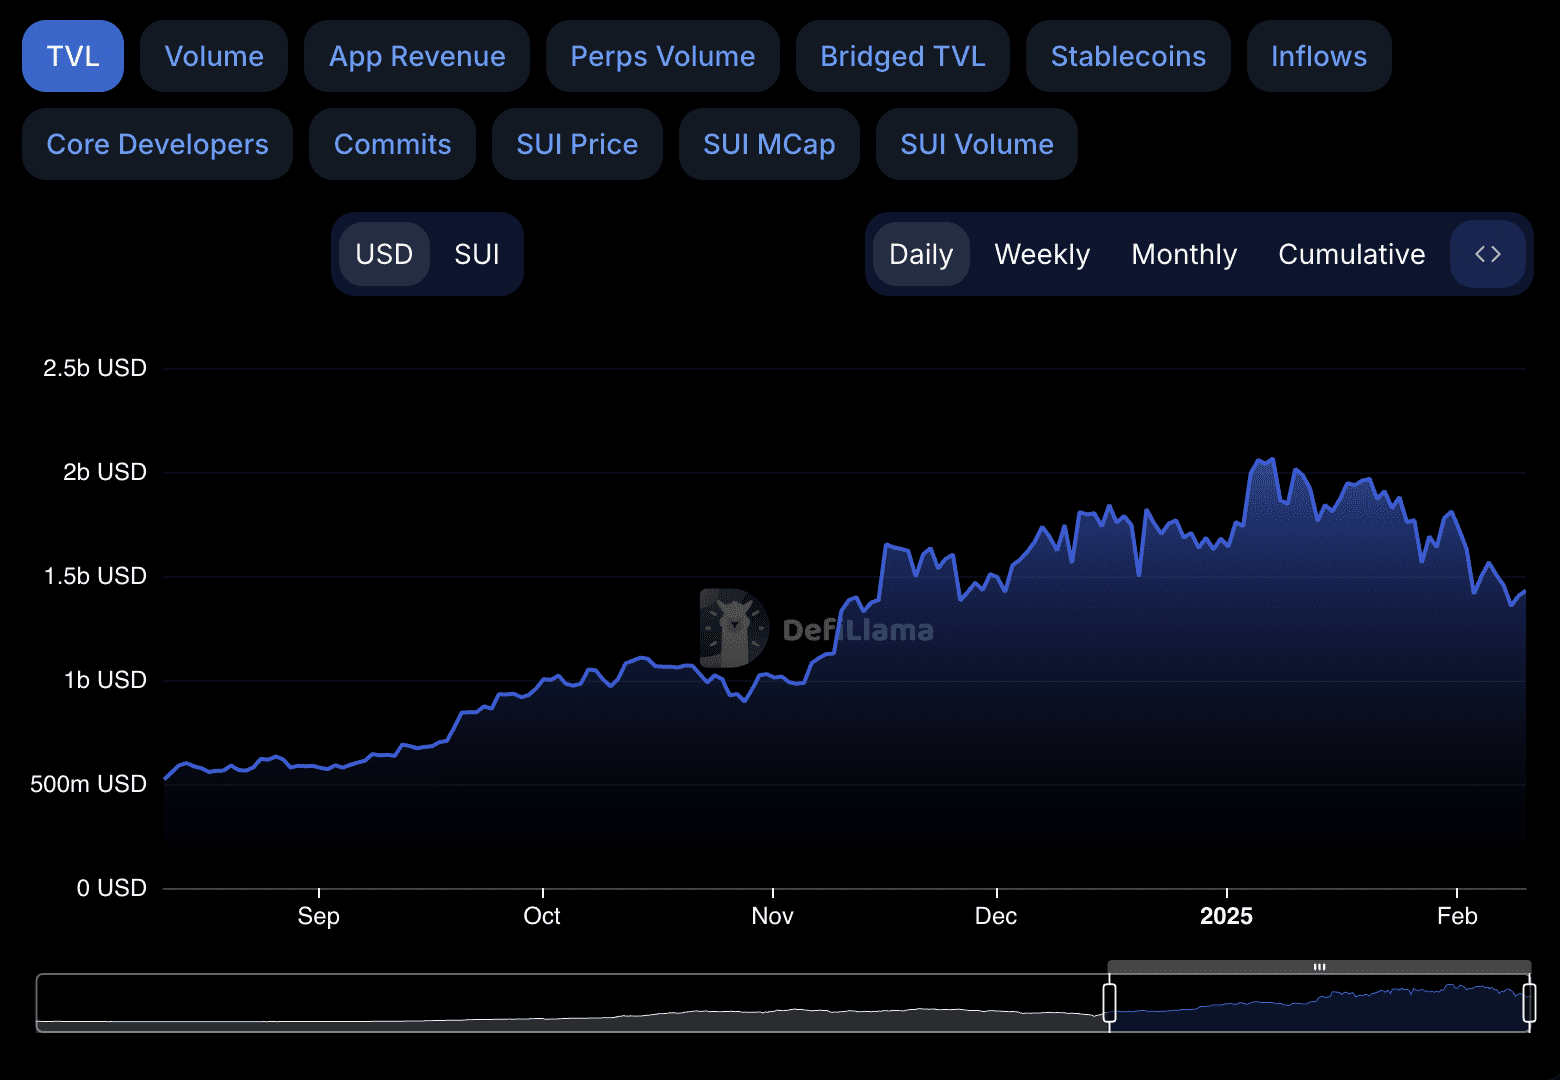
SUI TVL | Source: DeFiLlama
On-chain indicators across derivatives exchanges support a thesis for further gains in the token. The total funding rate aggregated by SUI across derivatives exchanges turned positive for the first time since last week.
The total open interest, indicative of the value of all open derivatives contracts, has climbed to $352.55 million as sentiment among traders shifts this week.
%20%5B17.55.05,%2010%20Feb,%202025%5D-638748009658924257.png)
Sui on-chain metrics | Source: Santiment
SUI could rally 23%, break out of a downward trend
The SUI/USDT daily ptice chart shows that the key momentum indicator, Relative Strength Index (RSI) is sloping upwards and reads 38. The Moving Average Convergence Divergence (MACD) indicator signals a waning underlying negative momentum in the SUI price trend.
SUI could find support in the imbalance zone between $2.85 and $3.02, a Fair Value Gap (FVG) on the daily timeframe.
SUI faces resistance in the FVG between $3.0758 and $4.0105. The target is the upper boundary of the imbalance zone at $4.0105.
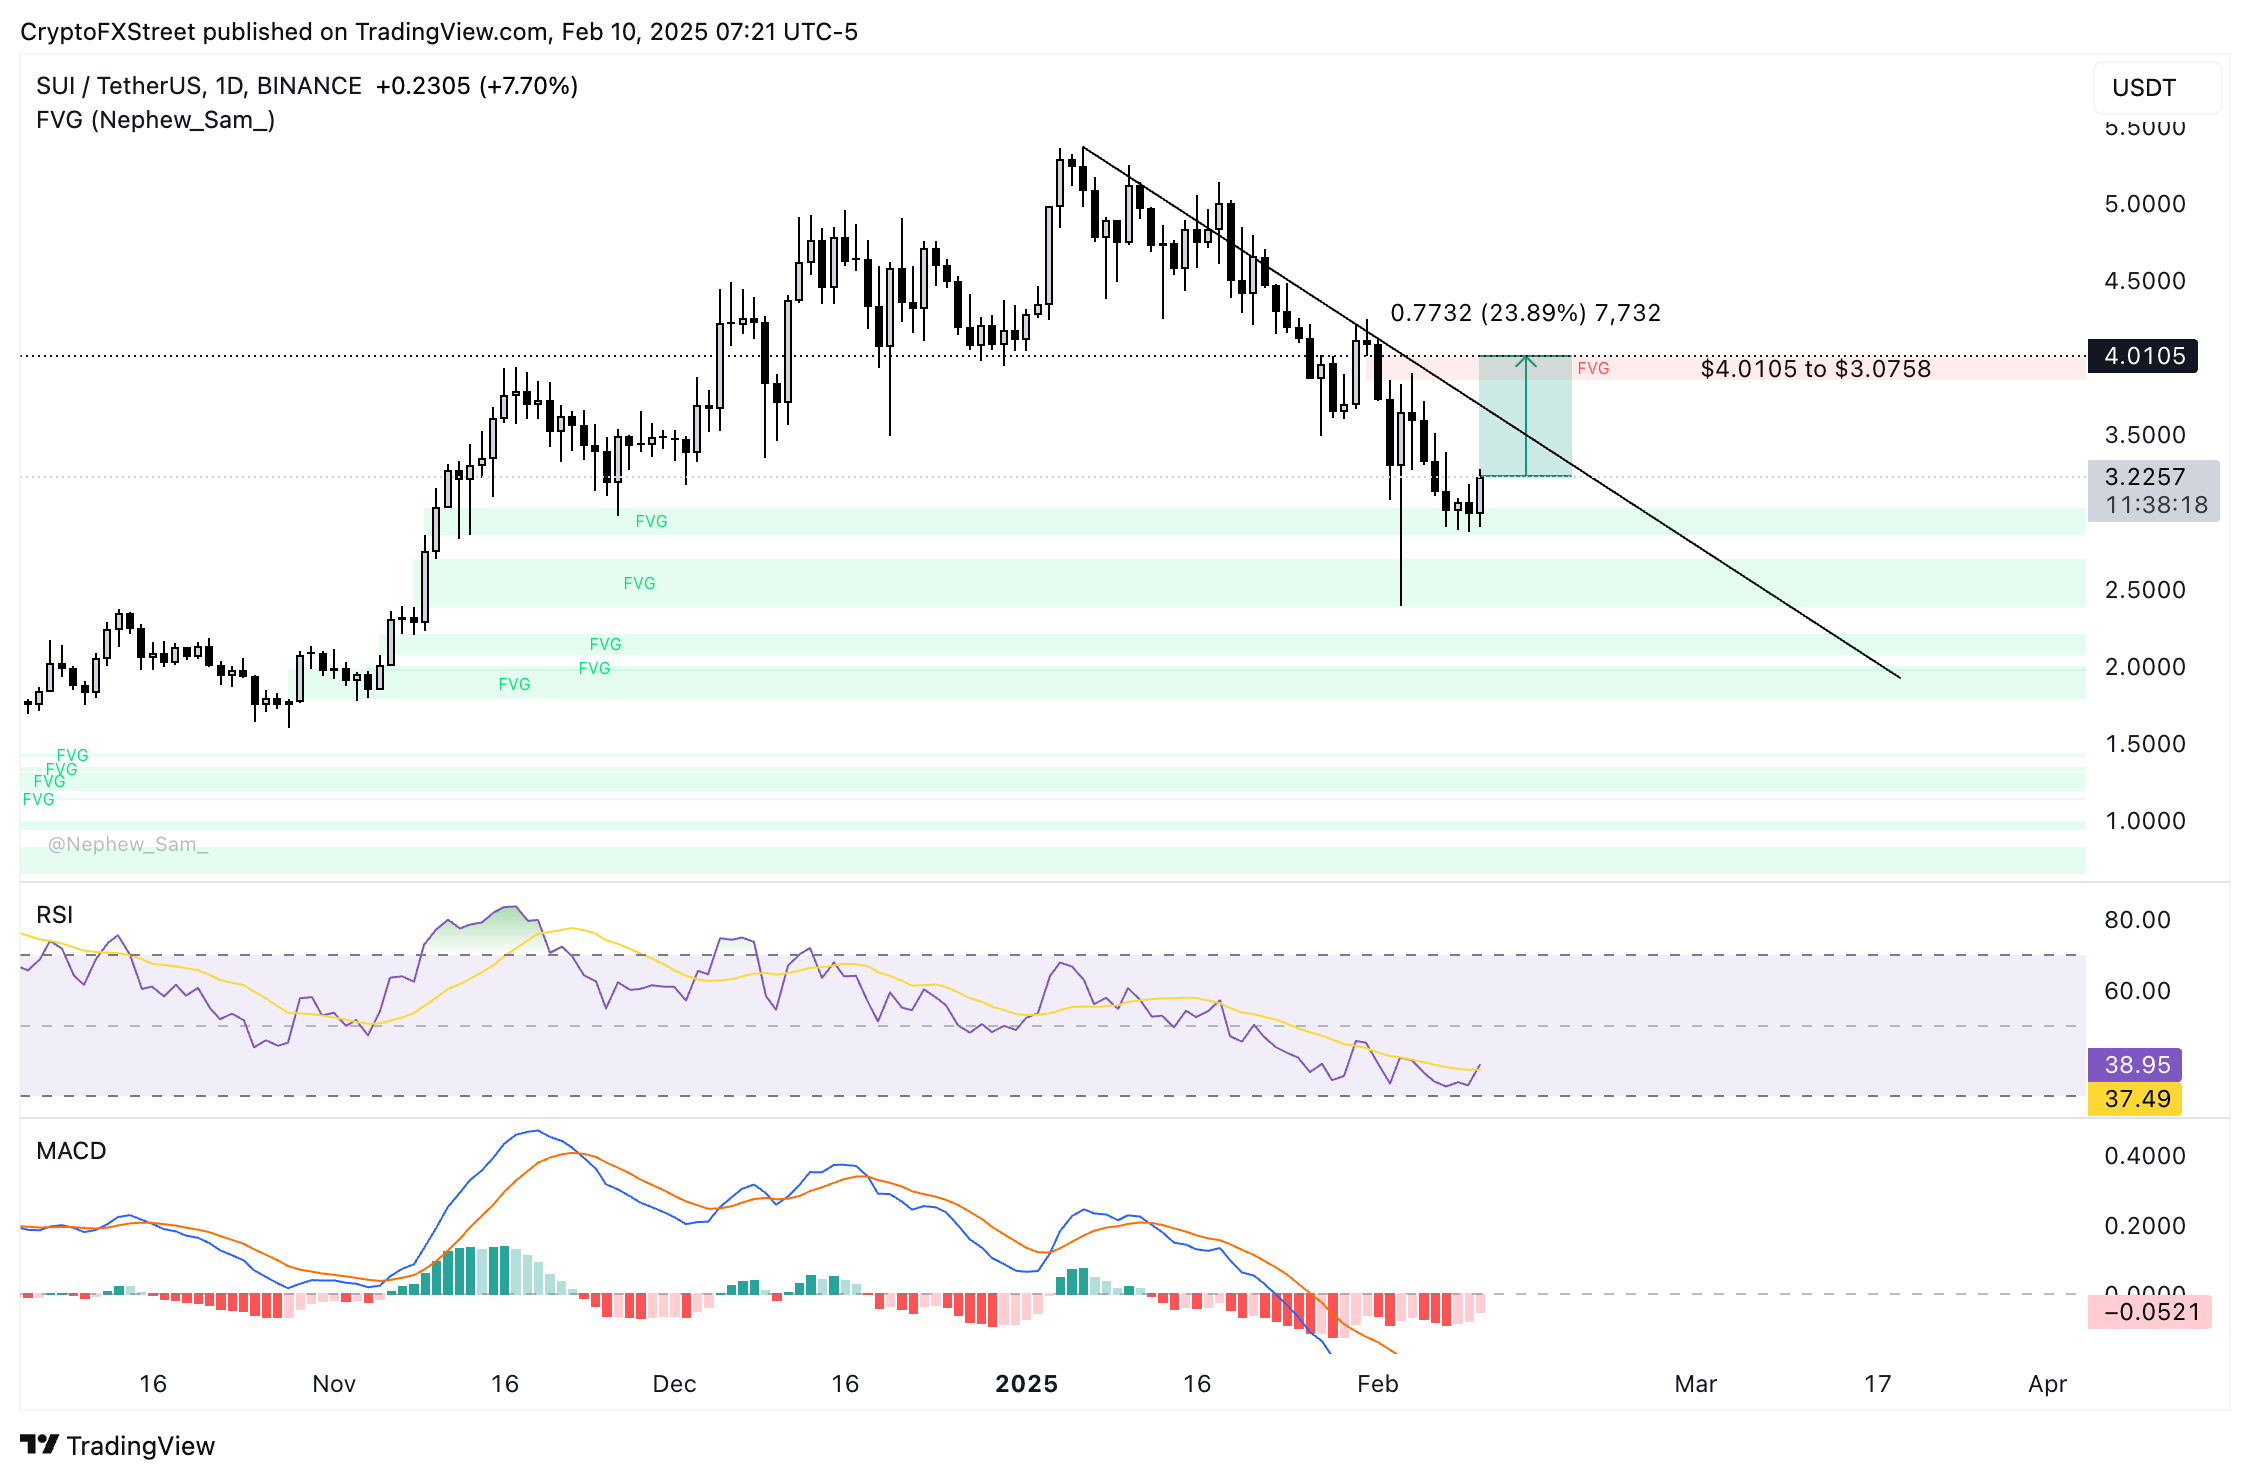
SUI/USDT price chart
A failure to break into the imbalance zone this week could imply a decline in the support zone and a correction to the $2.85 support level.

