
With the future and solvency of the Social Security program continually in doubt, it’s important to remember what a necessity the Social Security Administration (SSA) is in the lives of so many Americans. For many, especially those Americans over the age of 65 who are retired and living on fixed incomes, Social Security is what allows recipients to meet their annual cost of living and stay above the poverty line.
Also See: New Social Security Change Means You Could Owe Money
Check Out: 4 Low-Risk Ways To Build Your Savings in 2025
To that end, GOBankingRates recently analyzed all 50 states to determine those where people need Social Security the most. By studying the annual cost of living for every state, along with the percentage of each state’s population in citizens over the age of 65 living beneath the poverty line, GOBankingRates was able to determine the states in which Social Security is most needed by the recipients who live there.
While a few of the country’s most expensive states (e.g., New York, Hawaii) fill out the list, most of the states on this list are in the South, as poverty can thrive in more rural areas. Curious whether your state makes the top 20?
Also see what would happen to the money you paid into Social Security if the program were to end.
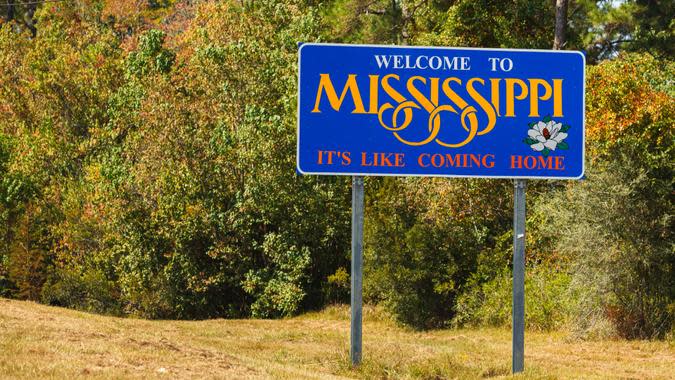
1. Mississippi
-
Annual cost of living: $34,681
-
Households with Social Security: 401,361
-
% of households with Social Security: 35.5%
-
% of people 65+ with income below poverty line: 14.3%
-
Average Social Security income: $21,322
Find Out: 40 States Where You’ll Feel the Biggest Social Security Increase This Year
See More: Who Would Benefit the Most from Trump’s Social Security Tax Plan?
Trending Now: Suze Orman’s Secret to a Wealthy Retirement–Have You Made This Money Move?

2. West Virginia
-
Annual cost of living: $34,202
-
Households with Social Security: 297,356
-
% of households with Social Security: 41.2%
-
% of people 65+ with income below poverty line: 11.2%
-
Average Social Security income: $22,747
Read More: 41 States That Won’t Tax Social Security Benefits in 2025
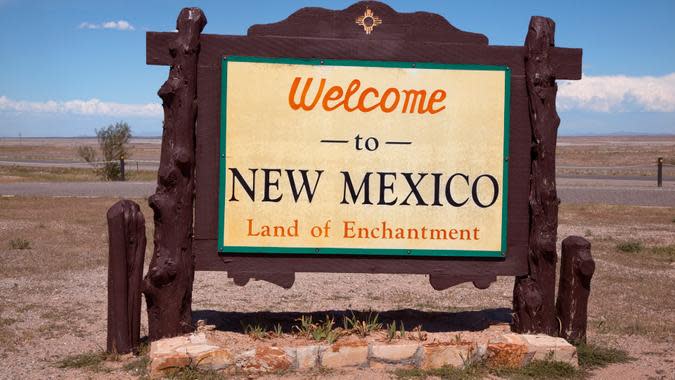
3. New Mexico
-
Annual cost of living: $43,965
-
Households with Social Security: 294,954
-
% of households with Social Security: 35.8%
-
% of people 65+ with income below poverty line: 13.1%
-
Average Social Security income: $21,968

4. Louisiana
-
Annual cost of living: $35,843
-
Households with Social Security: 564,018
-
% of households with Social Security: 31.6%
-
% of people 65+ with income below poverty line: 14.1%
-
Average Social Security income: $20,579

5. Kentucky
-
Annual cost of living: $38,286
-
Households with Social Security: 623,010
-
% of households with Social Security: 34.8%
-
% of people 65+ with income below poverty line: 12.3%
-
Average Social Security income: $21,889
Explore More: How Far $1.5 Million in Retirement Savings Plus Social Security Goes in Every State

6. Florida
-
Annual cost of living: $52,244
-
Households with Social Security: 3,139,979
-
% of households with Social Security: 36.7%
-
% of people 65+ with income below poverty line: 11.4%
-
Average Social Security income: $24,048

7. Alabama
-
Annual cost of living: $37,465
-
Households with Social Security: 692,939
-
% of households with Social Security: 35.2%
-
% of people 65+ with income below poverty line: 11.4%
-
Average Social Security income: $22,851

8. New York
-
Annual cost of living: $57,166
-
Households with Social Security: 2,445,342
-
% of households with Social Security: 31.9%
-
% of people 65+ with income below poverty line: 12.7%
-
Average Social Security income: $23,330
Find More: Trump Wants To Eliminate Social Security Taxes — Here’s How Much the Average Retiree Would Save

9. Arkansas
-
Annual cost of living: $35,767
-
Households with Social Security: 415,445
-
% of households with Social Security: 34.9%
-
% of people 65+ with income below poverty line: 11.2%
-
Average Social Security income: $22,351
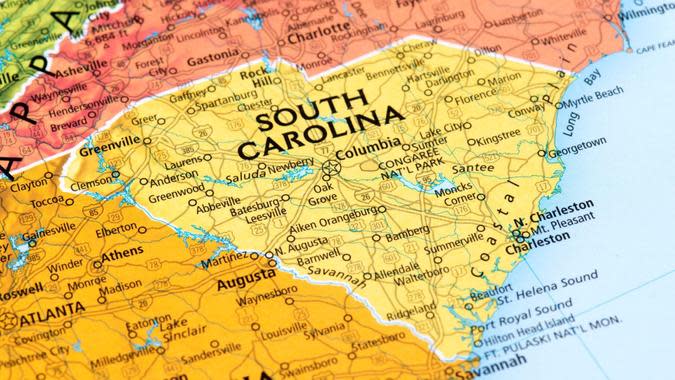
10. South Carolina
-
Annual cost of living: $43,713
-
Households with Social Security: 726,710
-
% of households with Social Security: 35.1%
-
% of people 65+ with income below poverty line: 10.7%
-
Average Social Security income: $23,985

11. Maine
-
Annual cost of living: $53,371
-
Households with Social Security: 219,575
-
% of households with Social Security: 37.3%
-
% of people 65+ with income below poverty line: 9.2%
-
Average Social Security income: $22,925
Know This: 8 Common Mistakes Retirees Make With Their Social Security Checks

12. Rhode Island
-
Annual cost of living: $59,817
-
Households with Social Security: 146,426
-
% of households with Social Security: 33.5%
-
% of people 65+ with income below poverty line: 10.5%
-
Average Social Security income: $23,167

13. Hawaii
-
Annual cost of living: $102,392
-
Households with Social Security: 181,793
-
% of households with Social Security: 37.2%
-
% of people 65+ with income below poverty line: 8.9%
-
Average Social Security income: $24,692

14. Tennessee
-
Annual cost of living: $43,609
-
Households with Social Security: 902,742
-
% of households with Social Security: 32.6%
-
% of people 65+ with income below poverty line: 10.8%
-
Average Social Security income: $23,430
For You: Need to Cut Expenses While on Social Security? Here’s the First Thing to Get Rid Of

15. Arizona
-
Annual cost of living: $54,185
-
Households with Social Security: 948,066
-
% of households with Social Security: 33.9%
-
% of people 65+ with income below poverty line: 9.9%
-
Average Social Security income: $25,049

16. Montana
-
Annual cost of living: $56,103
-
Households with Social Security: 156,515
-
% of households with Social Security: 34.6%
-
% of people 65+ with income below poverty line: 9.6%
-
Average Social Security income: $22,829

17. Pennsylvania
-
Annual cost of living: $42,196
-
Households with Social Security: 1,829,023
-
% of households with Social Security: 34.9%
-
% of people 65+ with income below poverty line: 9.4%
-
Average Social Security income: $23,989
Find Out: 8 States To Move to If You Don’t Want To Pay Taxes on Social Security

18. Michigan
-
Annual cost of living: $39,532
-
Households with Social Security: 1,402,046
-
% of households with Social Security: 34.7%
-
% of people 65+ with income below poverty line: 9.3%
-
Average Social Security income: $24,503

19. Missouri
-
Annual cost of living: $39,493
-
Households with Social Security: 812,042
-
% of households with Social Security: 32.7%
-
% of people 65+ with income below poverty line: 10.0%
-
Average Social Security income: $23,050

20. North Carolina
-
Annual cost of living: $46,728
-
Households with Social Security: 1,343,673
-
% of households with Social Security: 32.1%
-
% of people 65+ with income below poverty line: 10.2%
-
Average Social Security income: $23,610
Methodology: For this study, GOBankingRates analyzed each state to find the states where people need Social Security the most. Sources include the U.S. Census 2023 5-year American Community Survey, Sperling’s BestPlaces, the Bureau of Labor Statistics Consumer Expenditure Survey, Zillow Home Value Index and the Federal Reserve Economic Data. All data was collected on and is up to date as of May 15, 2025.
More From GOBankingRates
-
7 McDonald’s Toys Worth Way More Today
-
4 Companies as Much as Tripling Prices Due To Tariffs
-
Use This Checklist to See if Your Family is Financially Secure
-
7 Wealth-Building Shortcuts Proven To Add $1K to Your Wallet This Month
This article originally appeared on GOBankingRates.com: These Are the 20 States Where People Need Social Security the Most


