
The economy is big, complex and difficult for most people to understand. In reality, the president may not have as much control over the economy as people tend to think — the Federal Reserve, for instance, has a much more direct influence over how well the economy does.
Check Out: The Living Wage a Family of Four Needs in All 50 States
Learn More: How Middle-Class Earners Are Quietly Becoming Millionaires — and How You Can, Too
Nevertheless, economic performance continues to heavily influence how people choose to vote. If the economy does well, an incumbent president has a much better chance of being reelected. If there is a recession, their chances may be slim.
To be fair, the president does have some power to influence the economy. For one, trade policy can make a big impact. And during times of crisis, the president can expedite relief that may significantly lessen the long-term economic damage that may otherwise have lingered.
Still, the economy is complex. When we dive into the numbers, we realize most presidents have been good for the economy in some ways, and less good in others. This highlights the fact that despite what presidents say, their real-world economic impact may not be quite what we expect.
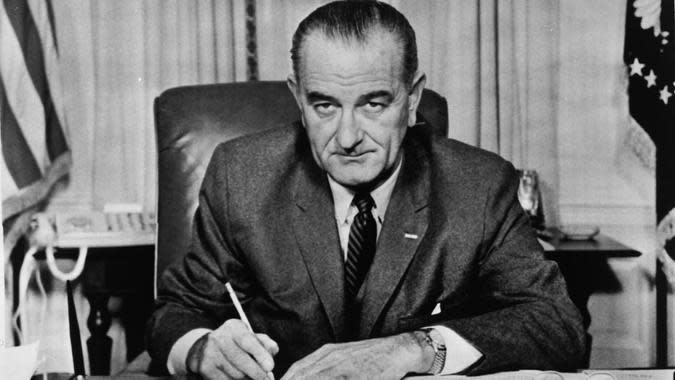
Lyndon B. Johnson (1963-69)
GDP growth: 2.6%
Unemployment rate: 3.4%
Inflation rate: 4.4%
Poverty rate: 12.8%
Real disposable income per capita: $17,181
Lyndon B. Johnson had many notable accomplishments, including the Clean Air Act and the Civil Rights Act. His presidency saw modest GDP growth but had the highest inflation-adjusted income on this list, along with the lowest unemployment rate. He is in the middle of the pack for inflation and poverty rates.
Also See: How Much Money Is Needed To Be Considered Middle Class in Every State?
Discover More: How Far $750,000 in Retirement Savings Plus Social Security Goes in Every State
Trending Now: Suze Orman’s Secret to a Wealthy Retirement–Have You Made This Money Move?
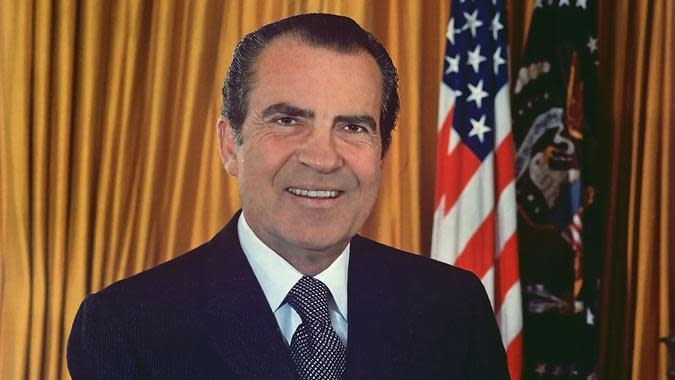
Richard Nixon (1969-74)
GDP growth: 2.0%
Unemployment rate: 5.5%
Inflation rate: 10.9%
Poverty rate: 12%
Real disposable income per capita: $19,621
Richard Nixon served one full term and resigned during his second term as a result of the Watergate scandal, becoming the first (and still only) president ever to do so. His presidency saw the second-highest rate of inflation mentioned here but also the second-highest inflation-adjusted income per capita. GDP growth was the fifth-lowest during his presidency, although he is in the middle of the pack for unemployment.
Explore More: How Long $1 Million in Retirement Will Last in Every State
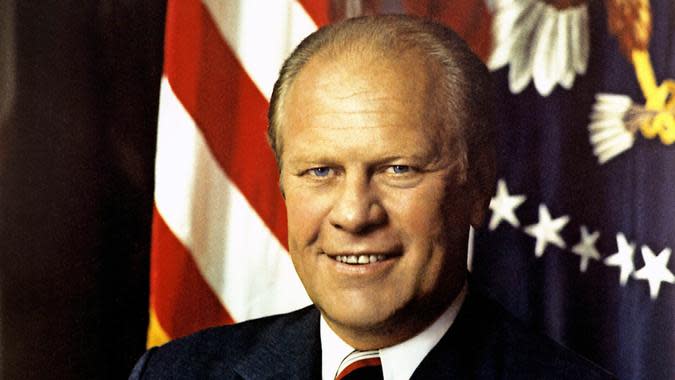
Gerald Ford (1974-77)
GDP growth: 2.8%
Unemployment rate: 7.5%
Inflation rate: 5.2%
Poverty rate: 11.9%
Real disposable income per capita: $20,780
Ford’s presidency, which lasted just 895 days, saw the second-highest rate of unemployment — second only to George W. Bush, who served during the Great Recession. On the plus side, he had the third-highest GDP growth, and poverty rates were on the low end. Inflation was third-highest during his presidency as well.

Jimmy Carter (1977-81)
GDP growth: 4.6%
Unemployment rate: 7.4%
Inflation rate: 11.8%
Poverty rate: 13%
Real disposable income per capita: $21,891
Jimmy Carter served for four years, from 1977 to 1981, and his presidency was unusual when you look at the numbers. His presidency had by far the highest GDP growth, more than 1% higher than President Joe Biden thus far. But he also had the highest inflation rate and the third-highest unemployment rate. He is in the middle of the pack for poverty rates.

Ronald Reagan (1981-89)
GDP growth: 2.1%
Unemployment rate: 5.4%
Inflation rate: 4.7%
Poverty rate: 13.1%
Real disposable income per capita: $27,080
Reagan’s presidency was marked mostly by numbers that don’t really stand out on either end. His unemployment rate is the fifth-lowest, but it is a full 2% higher than Johnson’s. He is fifth-highest for inflation, but at 4.7%, inflation during Reagan’s presidency was less than half of what it was during Carter’s. What may stand out the most is his 13.10% poverty rate, which is just slightly lower than George H.W. Bush, who has the highest poverty rate on this list.
Find Out: Here’s the Cost of Living in Every State
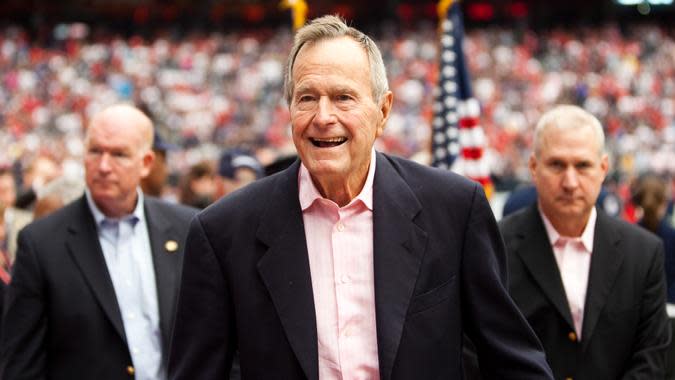
George H. W. Bush (1989-93)
GDP growth: 0.7%
Unemployment rate: 7.3%
Inflation rate: 3.3%
Poverty rate: 14.5%
Real disposable income per capita: $27,990
The aforementioned George H. W. Bush doesn’t have much going for him in terms of numbers; he has the highest poverty rate and the third-lowest GDP growth. His unemployment rate is also high at 7.3%, coming in just below Jimmy Carter. His biggest win is inflation, where he is fourth-lowest on this list.

Bill Clinton (1993-2001)
GDP growth: 0.3%
Unemployment rate: 4.2%
Inflation rate: 3.7%
Poverty rate: 11.3%
Real disposable income per capita: $34,216
Clinton’s presidency was not too different from his predecessor’s in terms of the numbers, which may highlight the president’s limited control over the economy. For instance, Clinton also had very slight GDP growth along with a low rate of inflation. That being said, he is the polar opposite of H. W. on poverty — H. W. has the highest poverty rate, and Clinton has the lowest. Clinton also has the third-lowest unemployment rate, in contrast to his predecessor.
George W. Bush (2001-09)
GDP growth: -1.2%
Unemployment rate: 7.8%
Inflation rate: 0.0%
Poverty rate: 13.2%
Real disposable income per capita: $37,814
Serving during the Great Recession means Bush’s numbers were bound to look bad. Indeed, he is the only president with a negative rate of GDP growth, and he has the highest unemployment rate. His poverty rate is the third highest as well. However, he also has the lowest inflation rate — the only president on this list with no (0.0%) inflation.
Trending Now: Here’s How Much You Need To Earn To Be ‘Rich’ in Every State
Barack Obama (2009-17)
GDP growth: 1.0%
Unemployment rate: 4.7%
Inflation rate: 2.5%
Poverty rate: 14%
Real disposable income per capita: $42,914
Barack Obama had the difficult task of taking over on the tail end of the Great Recession, and that may explain some of his numbers. For instance, GDP growth was the fourth lowest under him (though much better than his predecessor). The poverty rate was also the second highest under Obama. To his credit, though, he has the fourth-lowest unemployment rate — a stark contrast from Bush. Inflation was also low during his years in office.

Donald Trump (2017-21)
GDP growth: 2.6%
Unemployment rate: 6.4%
Inflation rate: 1.4%
Poverty rate: 11.90%
Real disposable income per capita: $48,286
When looking at the numbers, Donald Trump is mostly better than average. Inflation was just 1.4% during his years, which is the second lowest. The poverty rate during his years also ties him with Ford for the second lowest on this list. GDP growth was also fourth highest for him. At over 6% though, unemployment was on the high end for him, putting him fifth highest in that category.
Joe Biden (2021-25)
GDP growth: 3.2%
Unemployment rate: 4.8%
Inflation rate: 5.0%
Poverty rate: 12.4%
Real disposable income per capita: $51,822
The pandemic and the associated financial impact stoked an inflationary economy that was the worst since the Carter era, but the unemployment rate under Biden is the fourth lowest on this list, and GDP growth is the second highest.
More From GOBankingRates
6 Costco Products That Have the Most Customer Complaints
Mark Cuban Warns of ‘Red Rural Recession’ — 4 States That Could Get Hit Hard
How Middle-Class Earners Are Quietly Becoming Millionaires — and How You Can, Too
4 Low-Risk Ways To Build Your Savings in 2025
This article originally appeared on GOBankingRates.com: From LBJ to Biden: How the Economy Performed Under Each President

