
- Chainlink exchange outflows exceed $120 million in the last 30 days, hinting at increasing accumulation.
- The breakout from a falling wedge technical pattern and an uptrending RSI indicator signal stronger bullish momentum.
- LINK price struggles to sustain the uptrend amid stubborn resistance at the 50-day EMA.
Chainlink (LINK) price increases almost 3% on Tuesday to exchange hands at $13.47 at the time of writing. The oracle token, which has recovered 31% from $10.13 – the lowest year-to-date price seen on April 7 –, looks set to uphold its recent uptrend amid rising exchange outflows and a favourable technical setup. Still, the path beyond the $14 level looks more complicated due to the presence of strong resistance clusters.
Chainlink price uptrend buoyed by consistent exchange outflows
According to IntoTheBlock, Chainlink net exchange outflows have surpassed $120 million in the last 30 days. Net exchange outflows are the total amount of tokens withdrawn from exchanges minus the total amount deposited over a specified period.
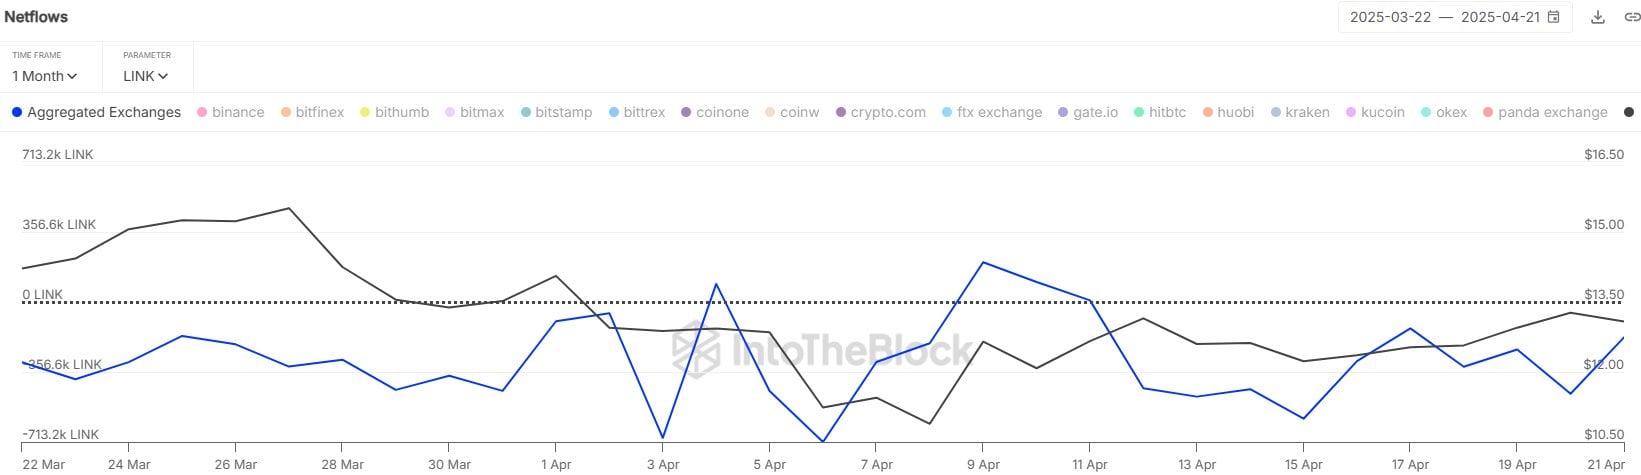
Chainlink net flows | Source: IntoTheBlock
A spike in net exchange outflows could be interpreted as bullish. It suggests that investors are moving funds from ‘hot exchange wallets’ to hold them long-term in self-custody wallets, reducing the available exchange balance and potentially propelling Chainlink’s price higher as sell-side pressure dwindles.
Net exchange outflows may also reflect accumulation trends, especially among large investors known as whales. Generally, token accumulation indicates growing optimism about future price increases.
However, other on-chain metrics suggest that the upward path for LINK could encounter some bumps. The In/Out of the Money (IOMAP) (highlighted in the chart below) shows that Chainlink sits above smaller support areas than larger resistance clusters.
As Chainlink’s price moves higher, investors who previously purchased approximately 108,000 LINK between $14.93 and $15.37 could sell at breakeven, dampening sentiment and preventing further price increases. Looking down, due to weaker support clusters, declines could erase the gains accrued in the last two weeks after the tariff-triggered crash.
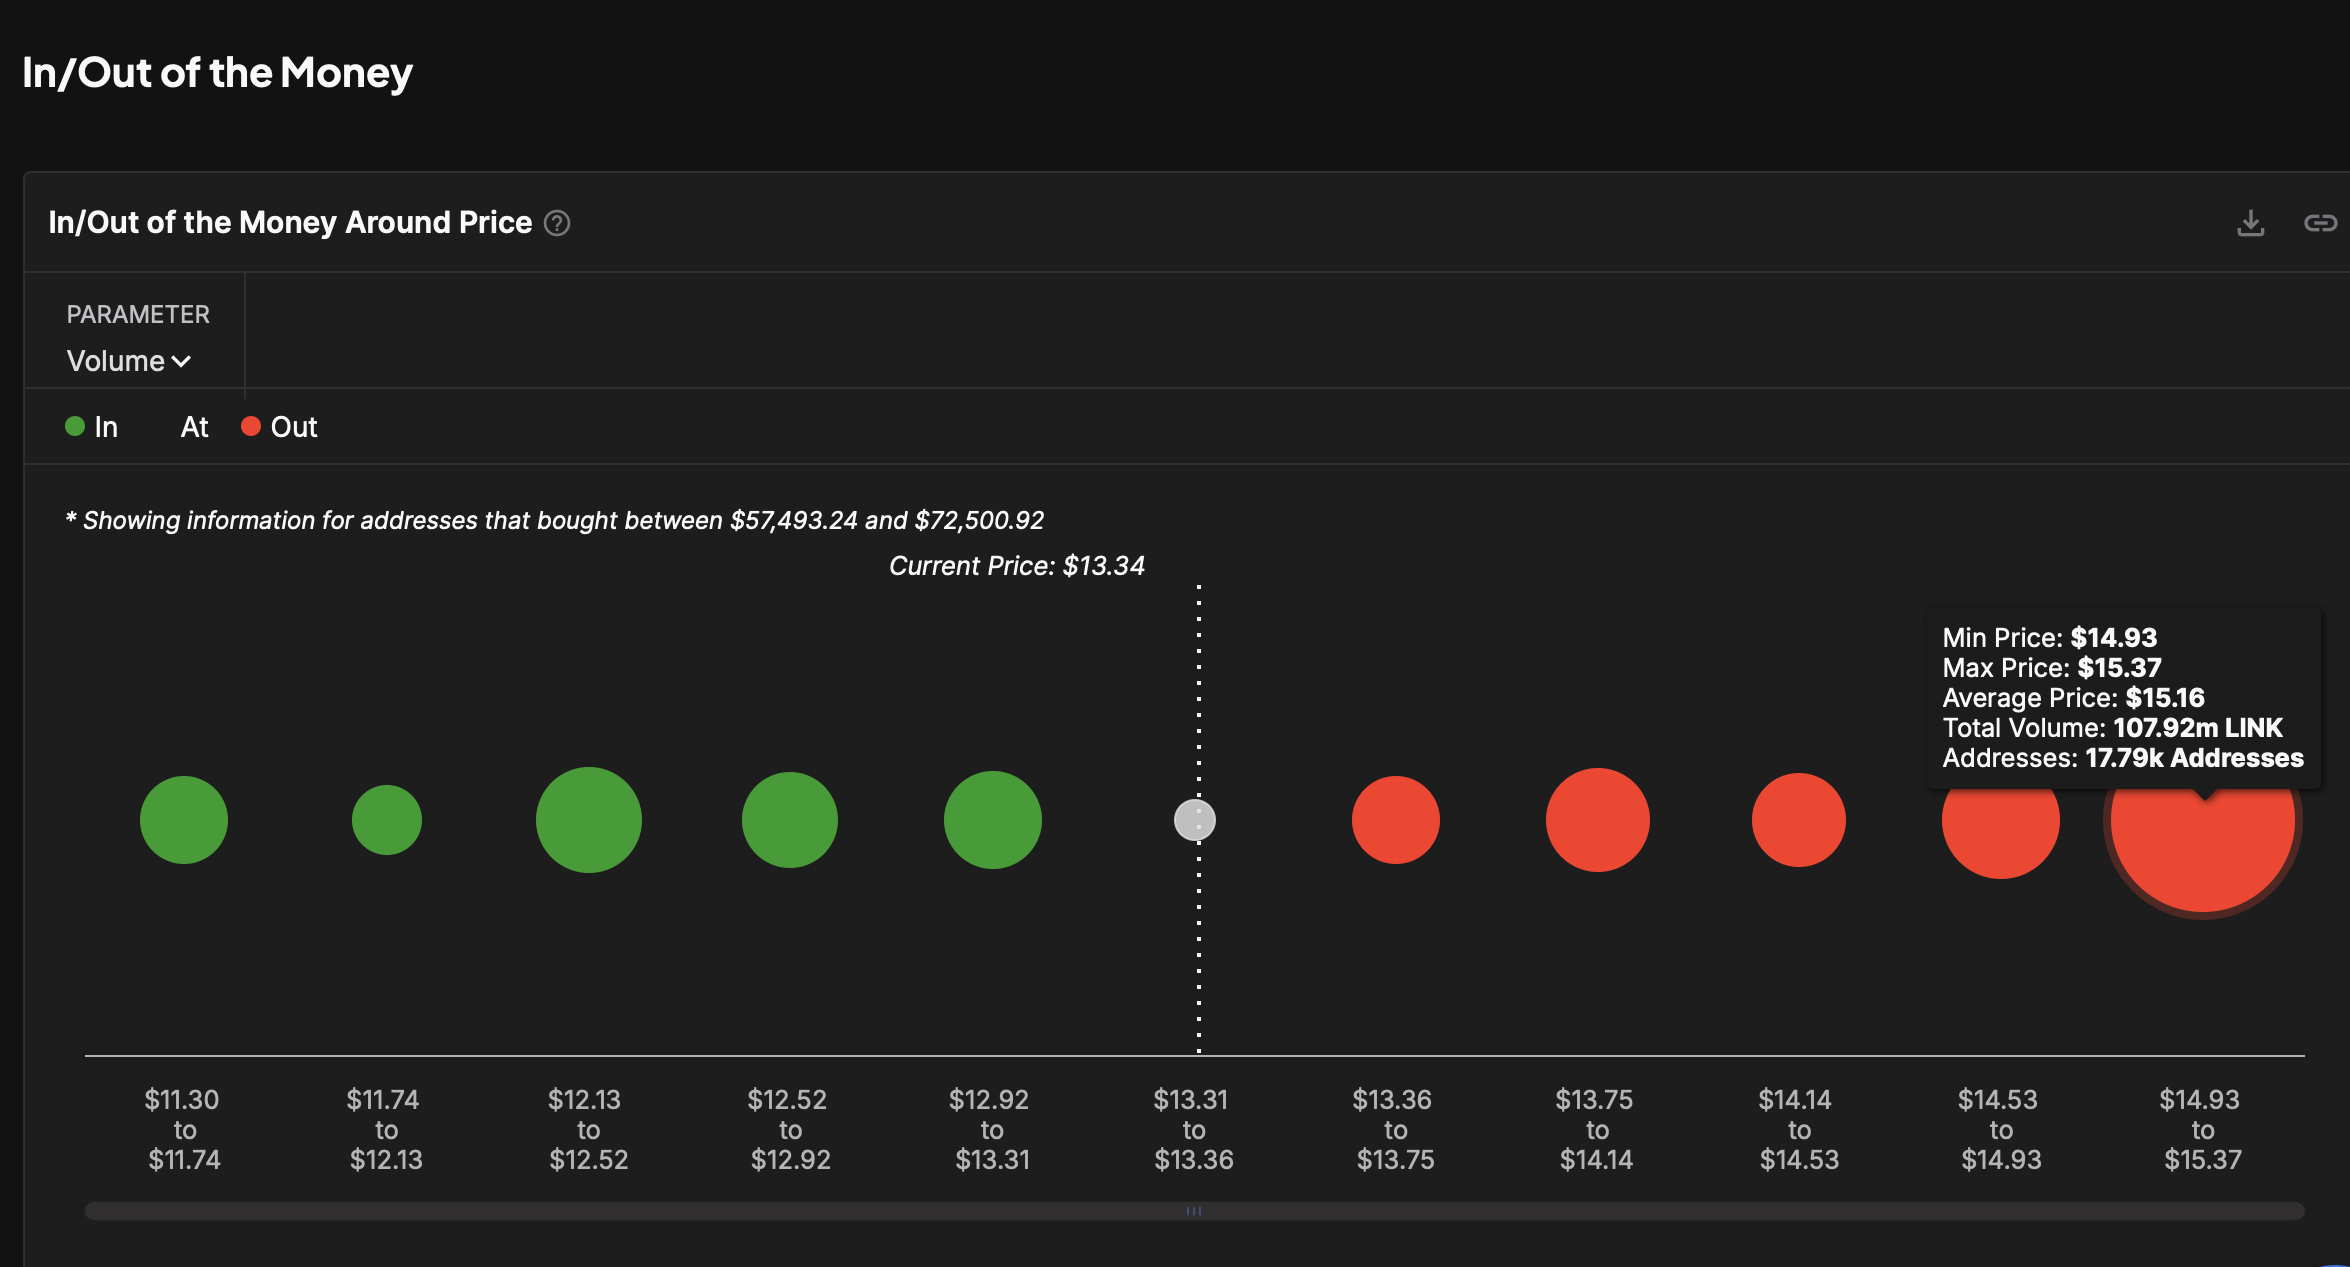
Chainlink’s IOMAP metric | Source: IntoTheBlock
LINK price runs into crucial resistance clusters
Chainlink’s technical setup shows some signs that it could extend the uptrend to $15.28. This is because LINK price broke out from a falling wedge pattern on Friday, a bullish sign, targeting a 25% increase to $15.28. This target is arrived at by measuring the distance between the pattern’s widest points, as shown in the daily chart extrapolated above the breakout point.
The Relative Strength Index (RSI) at 52.66 and trending upward indicates Chainlink remains in a neutral zone, yet bullish momentum could be building up. If traders maintain interest in LINK and delay profit-taking, this momentum could drive the token toward the wedge pattern’s target of $15.28, potentially even extending gains to the $20.00 resistance level last tested in February.
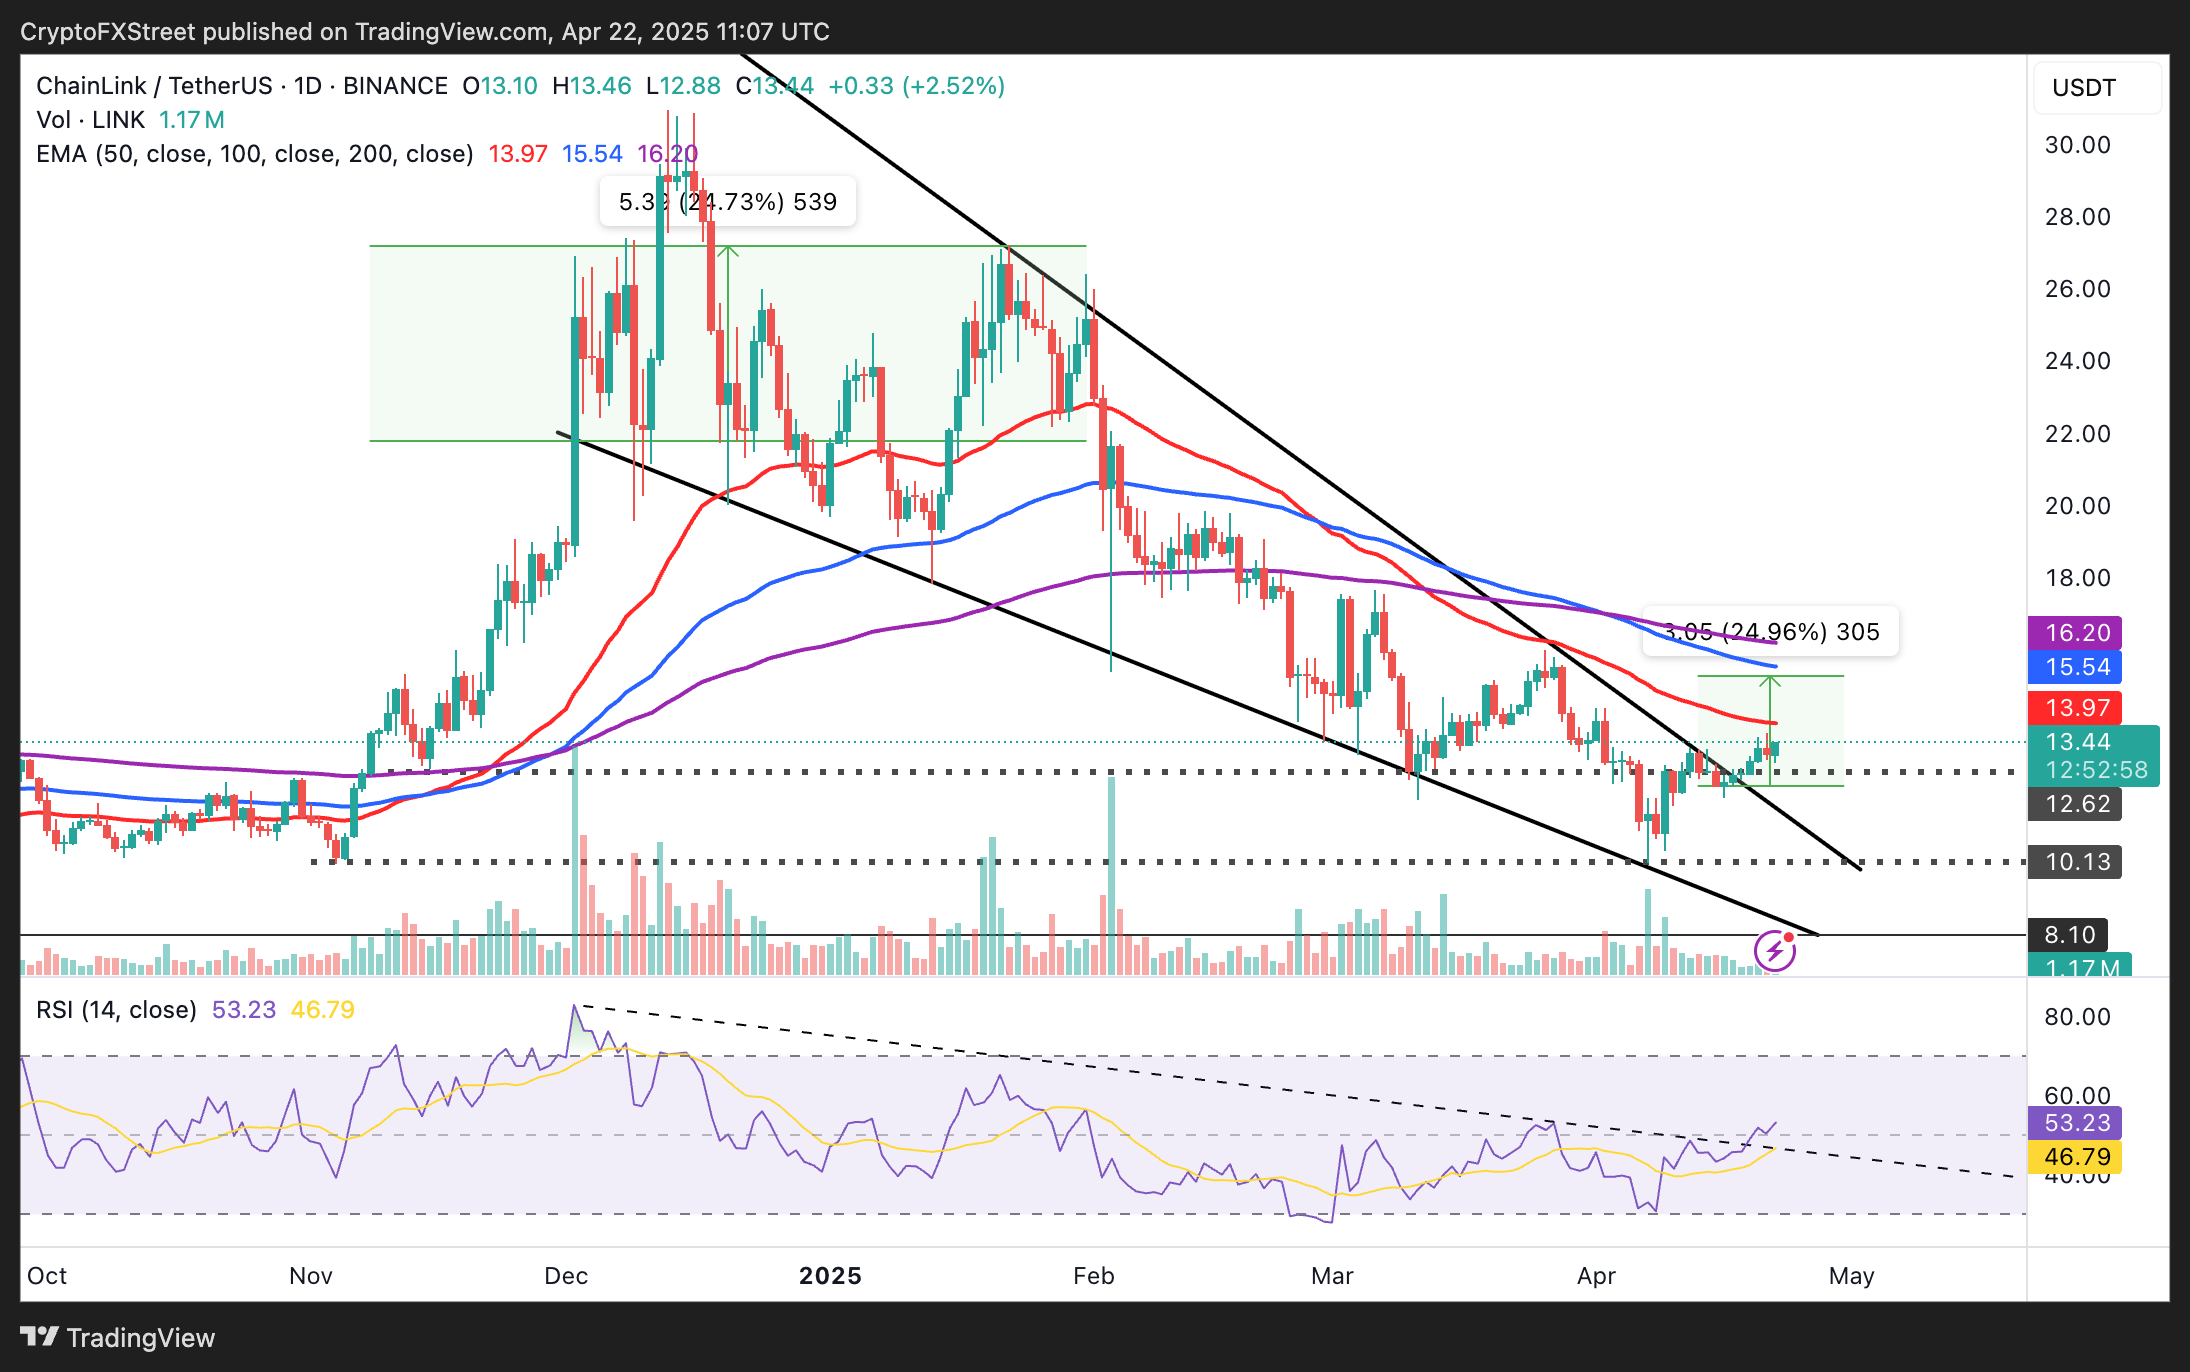
LINK/USDT daily chart
Beyond the resistance levels shown by the IOMAP, Chainlink price holds below the 50, 100, and 200-day Exponential Moving Averages (EMA) indicators, hinting at possible challenges to the uptrend. Therefore, it is essential to prepare for different outcomes, including profit-taking at the 50-day EMA ($13.97), the 100-day EMA ($15.54), and the 200 EMA ($16.20).
If the immediate resistance at $13.97 is rejected, traders may look toward the previously tested $12.20 area for support before extending the fall to the April 7 low of $10.13.
")


