


- Chainlink active addresses slide dramatically to 3,200 from February’s peak of 9,400.
- The downtrend in network activity coincides with increasing selling activity among whales with between 10 million and 100 million LINK.
- The long-term RSI downtrend underscores bearish sentiment, signaling Chainlink may retest the $10 support level.
- If validated, a falling wedge pattern in the daily timeframe could reverse the bearish trend.
Chainlink (LINK) has seen a lackluster downward trend in its performance since reaching a peak of $30.86 in December. Despite targeted attempts from bulls to change course, recovery for the Oracle network token remains elusive, with LINK sliding by 0.74% on the day to trade at $12.15 at the time of writing on Wednesday. These rampant downside risks can be attributed to weak fundamentals observed from several metrics, including network and whale activity.
Chainlink active address on a free fall
According to CryptoQuant data, the Active Addresses on-chain metric continues to sustain an overall downward trend from its peak of approximately 9,400 addresses in February to roughly 3,200 addresses as of Tuesday. This marks a 66% decline in two and a half months and a 72% drop from the metric’s December peak of approximately 11,400 addresses.
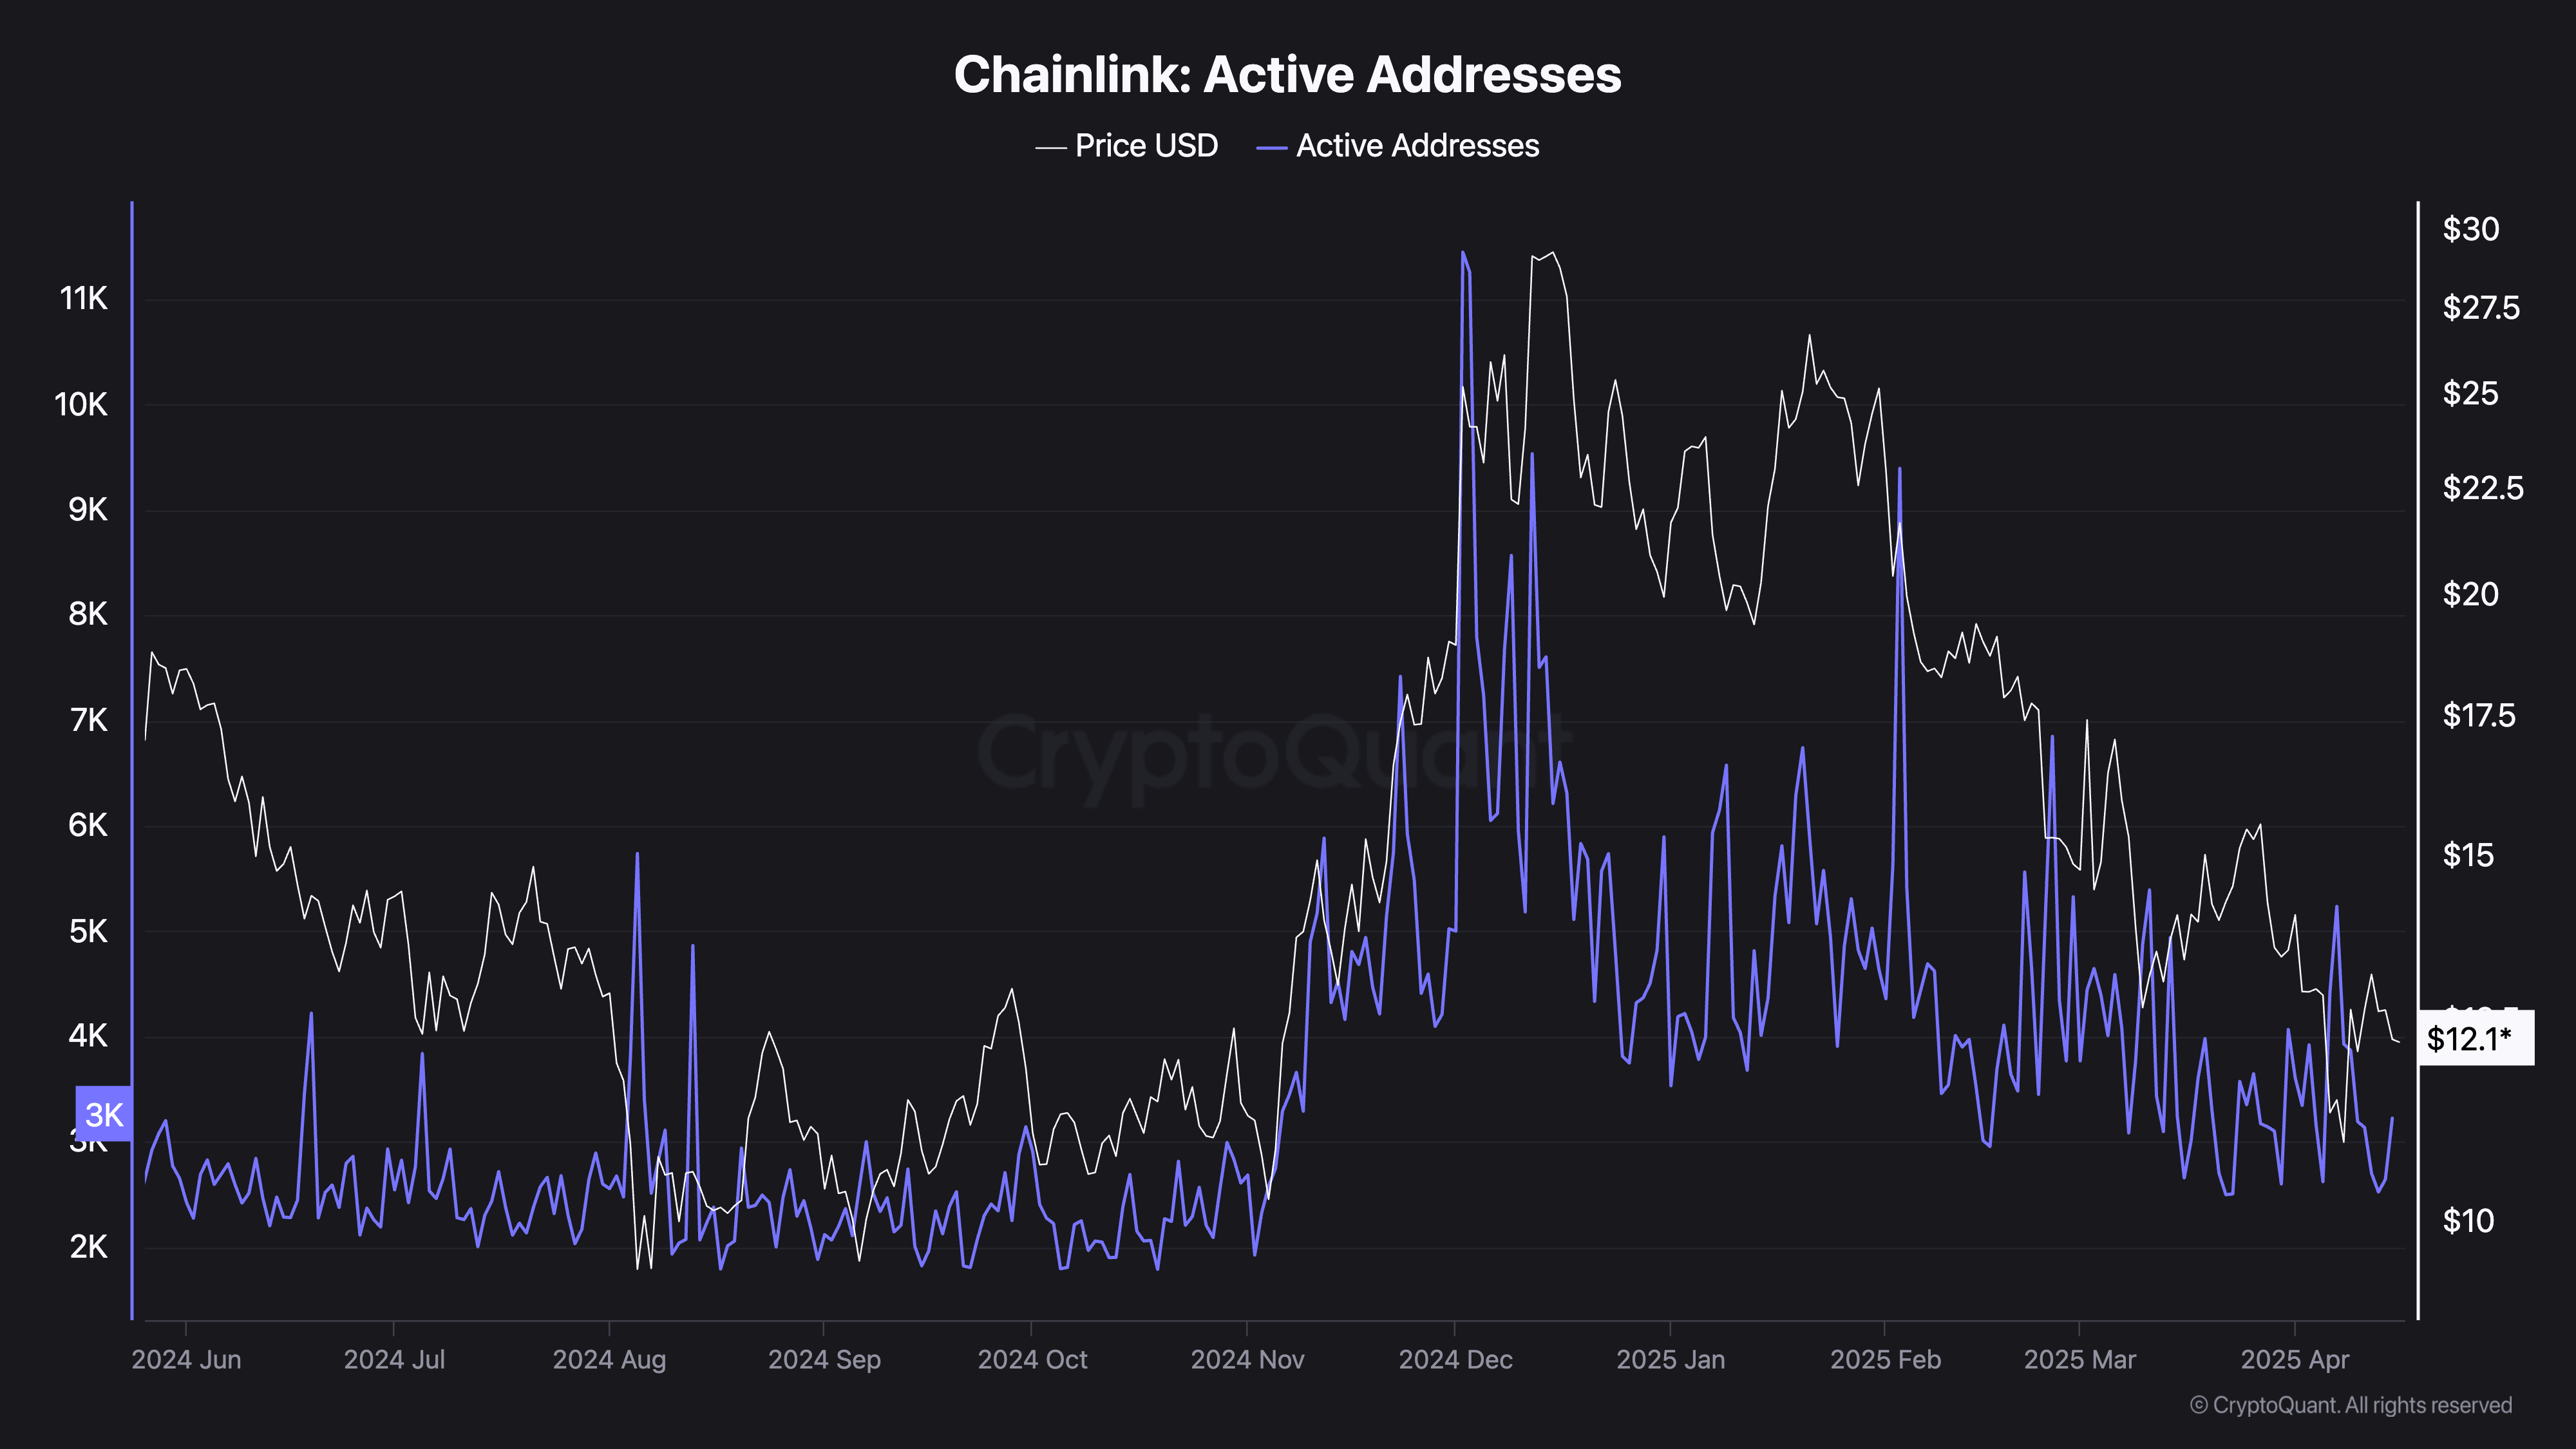
Chainlink Active Addresses metric | Source: CryptoQuant
The chart above shows a close positive correlation between Chainlink’s price and the Active Address metric, which measures the number of unique addresses interacting with the Oracle network by sending or receiving LINK. A sustained decline in this metric suggests low network activity, which may reflect waning user engagement and low confidence in the ecosystem.
At the same time, a noticeable spike in whale selling pressure affirms the concerns about declining user engagement and low confidence among traders. Santiment’s data reveals that between February and mid-April, addresses with between 10 million and 100 million LINK tokens reduced their holdings by 1.88%. This whale cluster currently holds 46.04% of Chainlink’s total supply.
%20%5B12-1744804980795.35.13,%2016%20Apr,%202025%5D.png)
Chainlink Supply Distribution | Source: Santiment
The spike in whale selling activity alongside the slump in active addresses greatly undermines Chainlink’s competitiveness, potentially driving the price down. Therefore, these metrics are worth paying attention to amid the prevailing uncertainty and as LINK closes in on the key support area around $10.00.
Can Chainlink defy weak fundamentals for a quick reversal?
A falling wedge pattern in the daily timeframe signals a potential rebound if validated in the short term. This bullish pattern is formed by drawing two downward-sloping trendlines connecting a series of lower highs and lows, as shown in the daily chart below.
Bulls must break the upper trendline resistance amid increasing trading volume to validate the wedge pattern. LINK could then rise 24% to $15.17, a distance equal to the wedge’s widest points extrapolated above the breakout point.
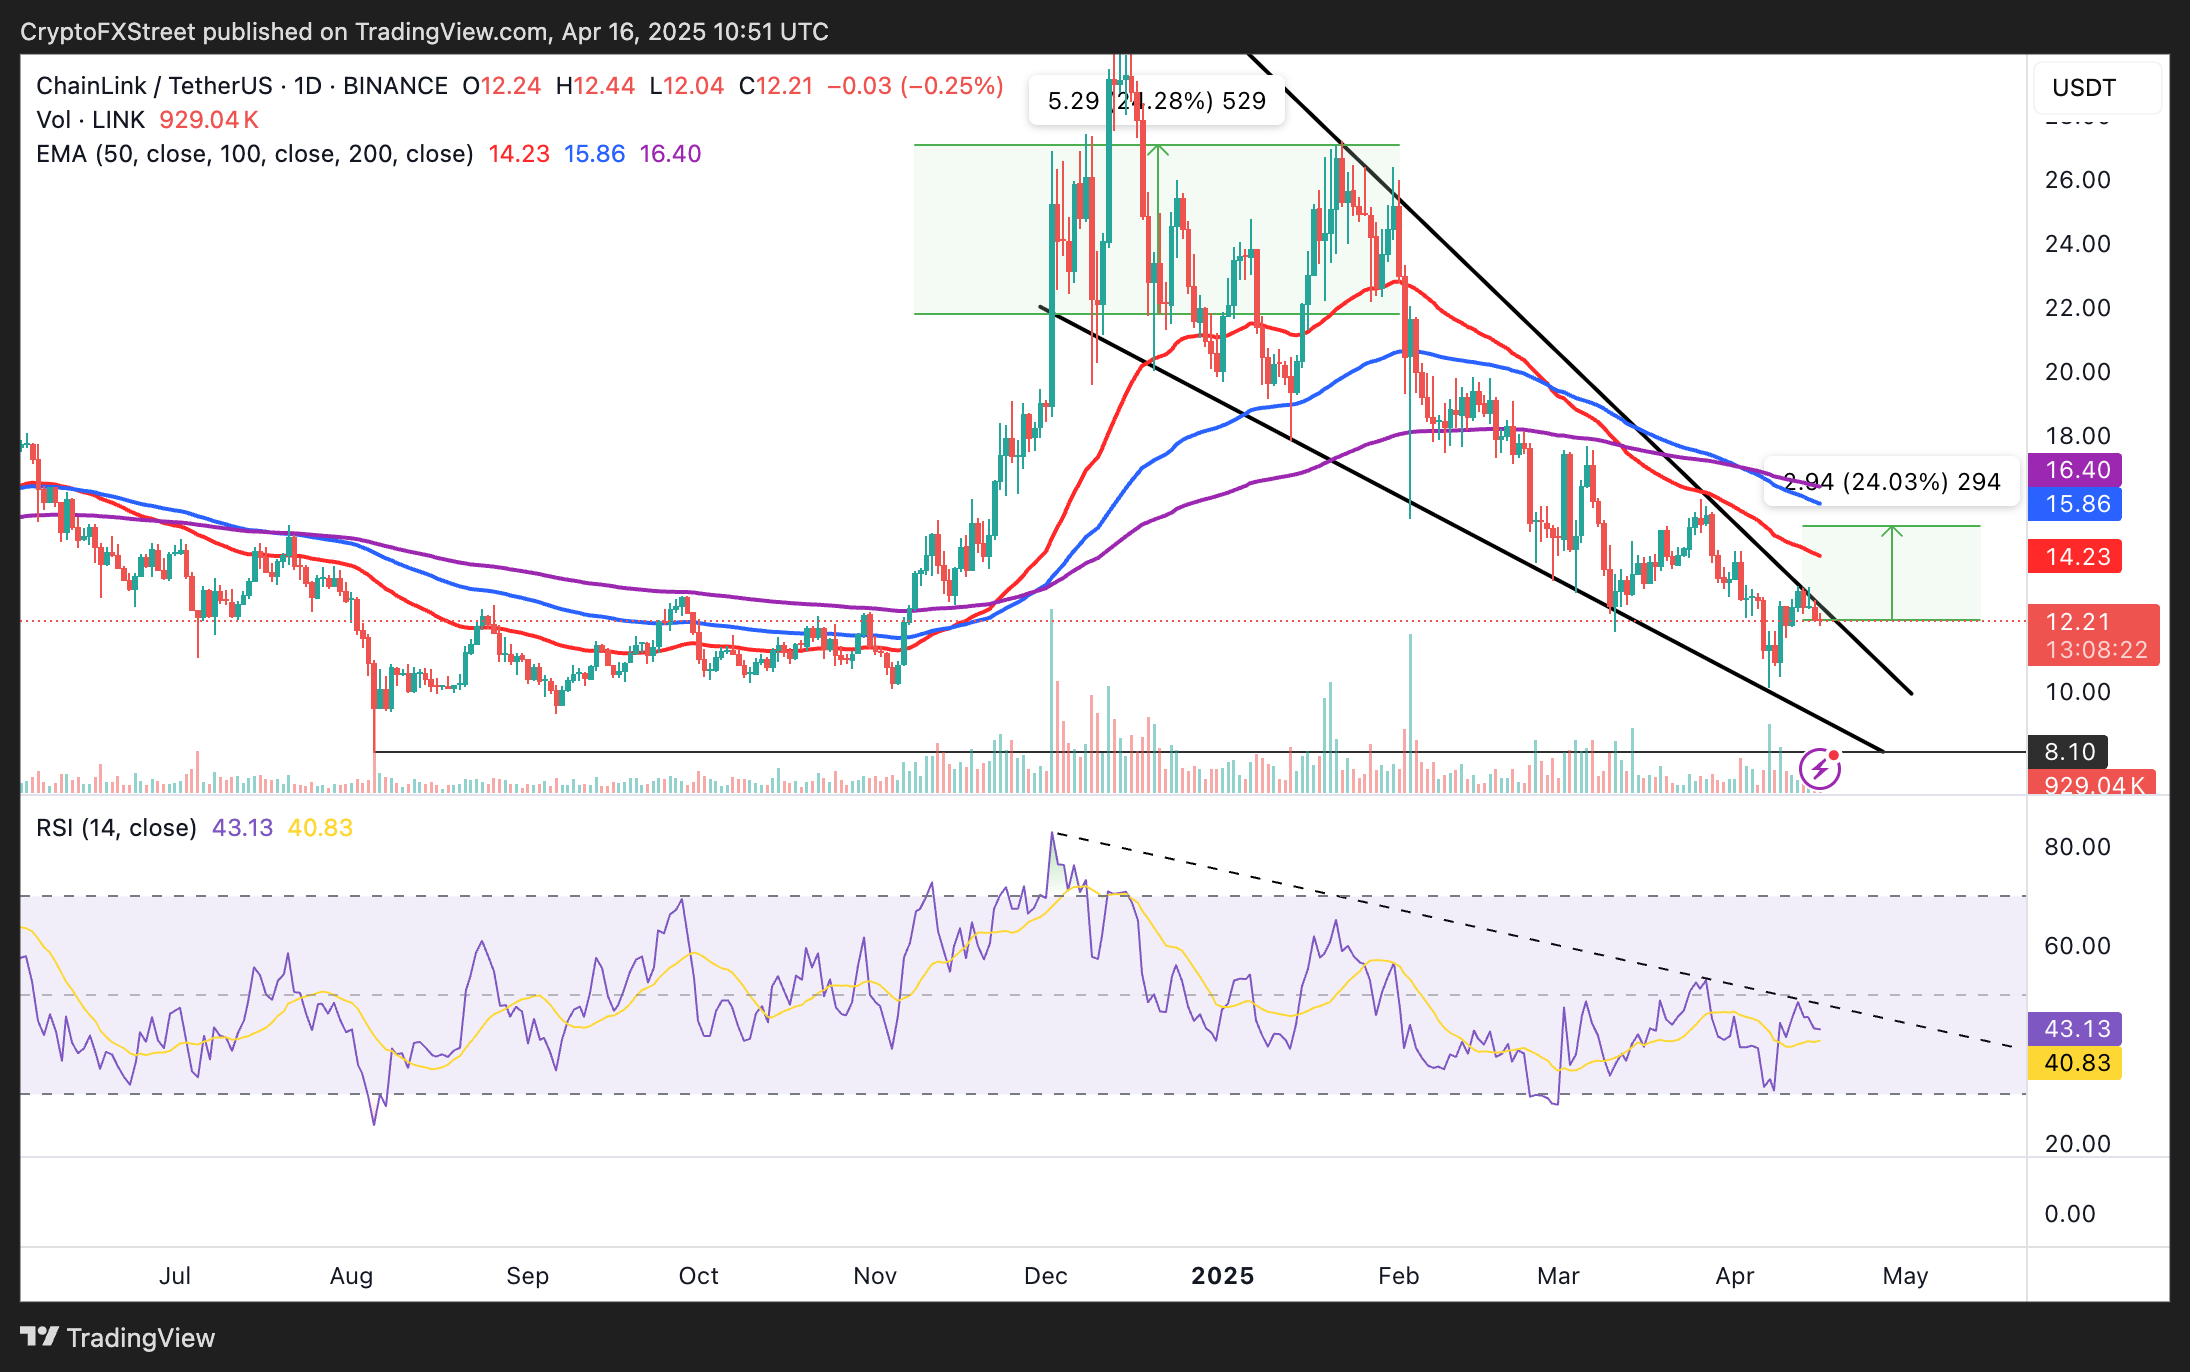
LINK/USD daily chart
However, the downtrend in the Relative Strength (RSI) indicator shows that bears have the upper hand and may continue to drive the LINK price down.
Support at $10.00 could be retested if the RSI indicator drops further from its current position at 43.00. Traders cannot rule out extended declines below this level, as a spike in selling pressure might accelerate the fall to $8.10, the lowest level since August 5, 2024.

