
- Bitcoin, Ethereum and XRP rally and add between 2% and 3% to their value on Monday.
- Crypto market capitalization crosses $2.85 trillion as crypto tokens are in the green.
- Amidst the brewing trade war, traders remain uncertain and BTC gains are capped under resistance at $88,000.
Bitcoin (BTC), Ethereum (ETH) and XRP, the top three cryptocurrencies by market capitalization, extend their last week’s recovery on Monday, even as trader sentiment is hurt by the US President Donald Trump’s tariff policy and announcements. Bitcoin’s correlation with US equities and tech stocks continues to limit gains below the $88,000 resistance on Monday.
The top 10 cryptocurrencies are in the green, with prices either unchanged or climbing slightly in the last 24 hours, CoinGecko data shows.
Tariffs, headlines and fear dictate crypto market price
The Crypto Fear & Greed Index, which measures the sentiment among crypto traders, reads 39 on a scale of 0 to 100, meaning traders remain fearful, however, less so, compared to last week and month readings of 31 and 32, respectively.
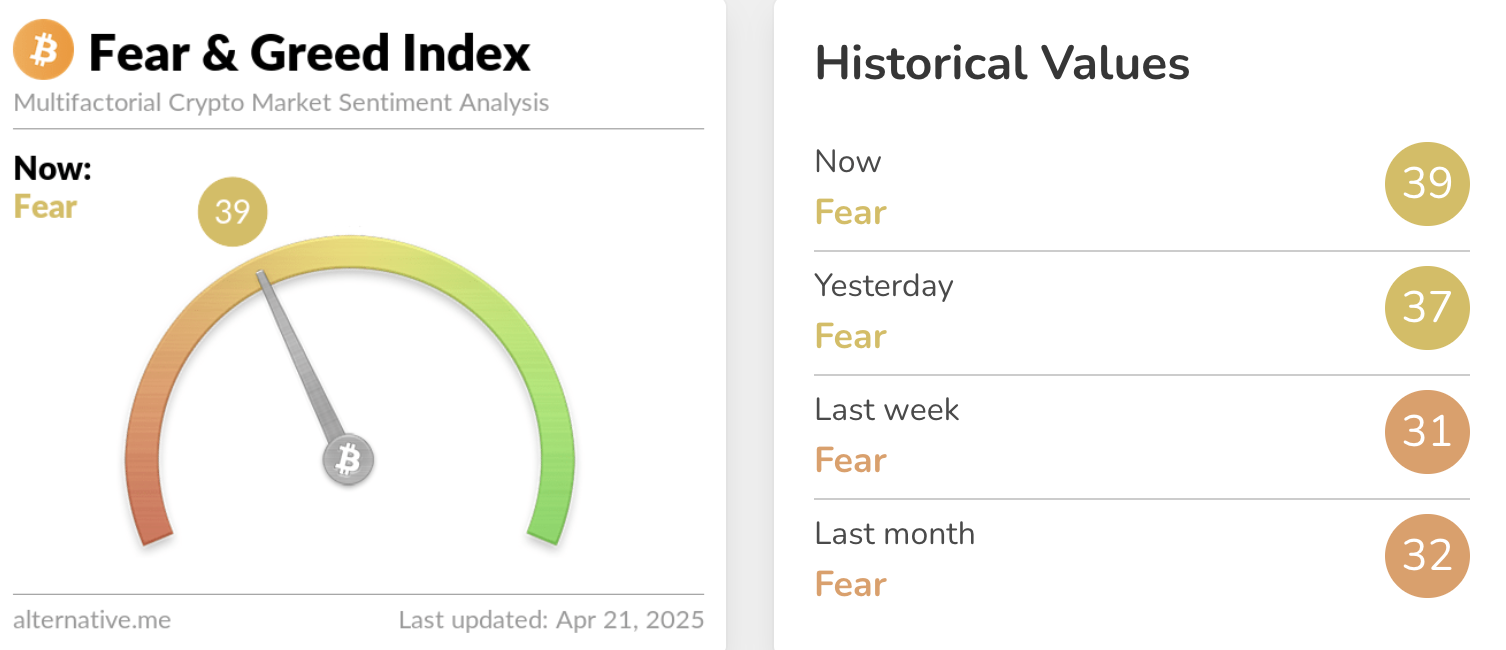
Crypto Fear & Greed Index | Source: Alternative
The total market capitalization of all crypto tokens climbs to $2.85 trillion at the time of writing on Monday, up from $2.76 trillion on April 1, a 3.2% increase so far this month. With no shortage of market-moving headlines, the sentiment is slowly improving, market capitalization climbs and Bitcoin tests sticky resistance close to $88,000.
Is it a buy or a fakeout?
The US continues to impose absurdly high tariffs on China, Gold hits new all-time highs and Bitcoin is slowly losing its edge as “digital Gold,” and a “safe haven.” The crypto market continues to test fundamentals and facts from previous cycles.
Bitcoin recovered from several flash crashes since the result of the US Presidential election in November, but at what price? The effect of the Trump administration’s tendency to flood the market with headlines is waning and BTC has observed no significant rally since March, despite a slew of pro-crypto announcements and developments.
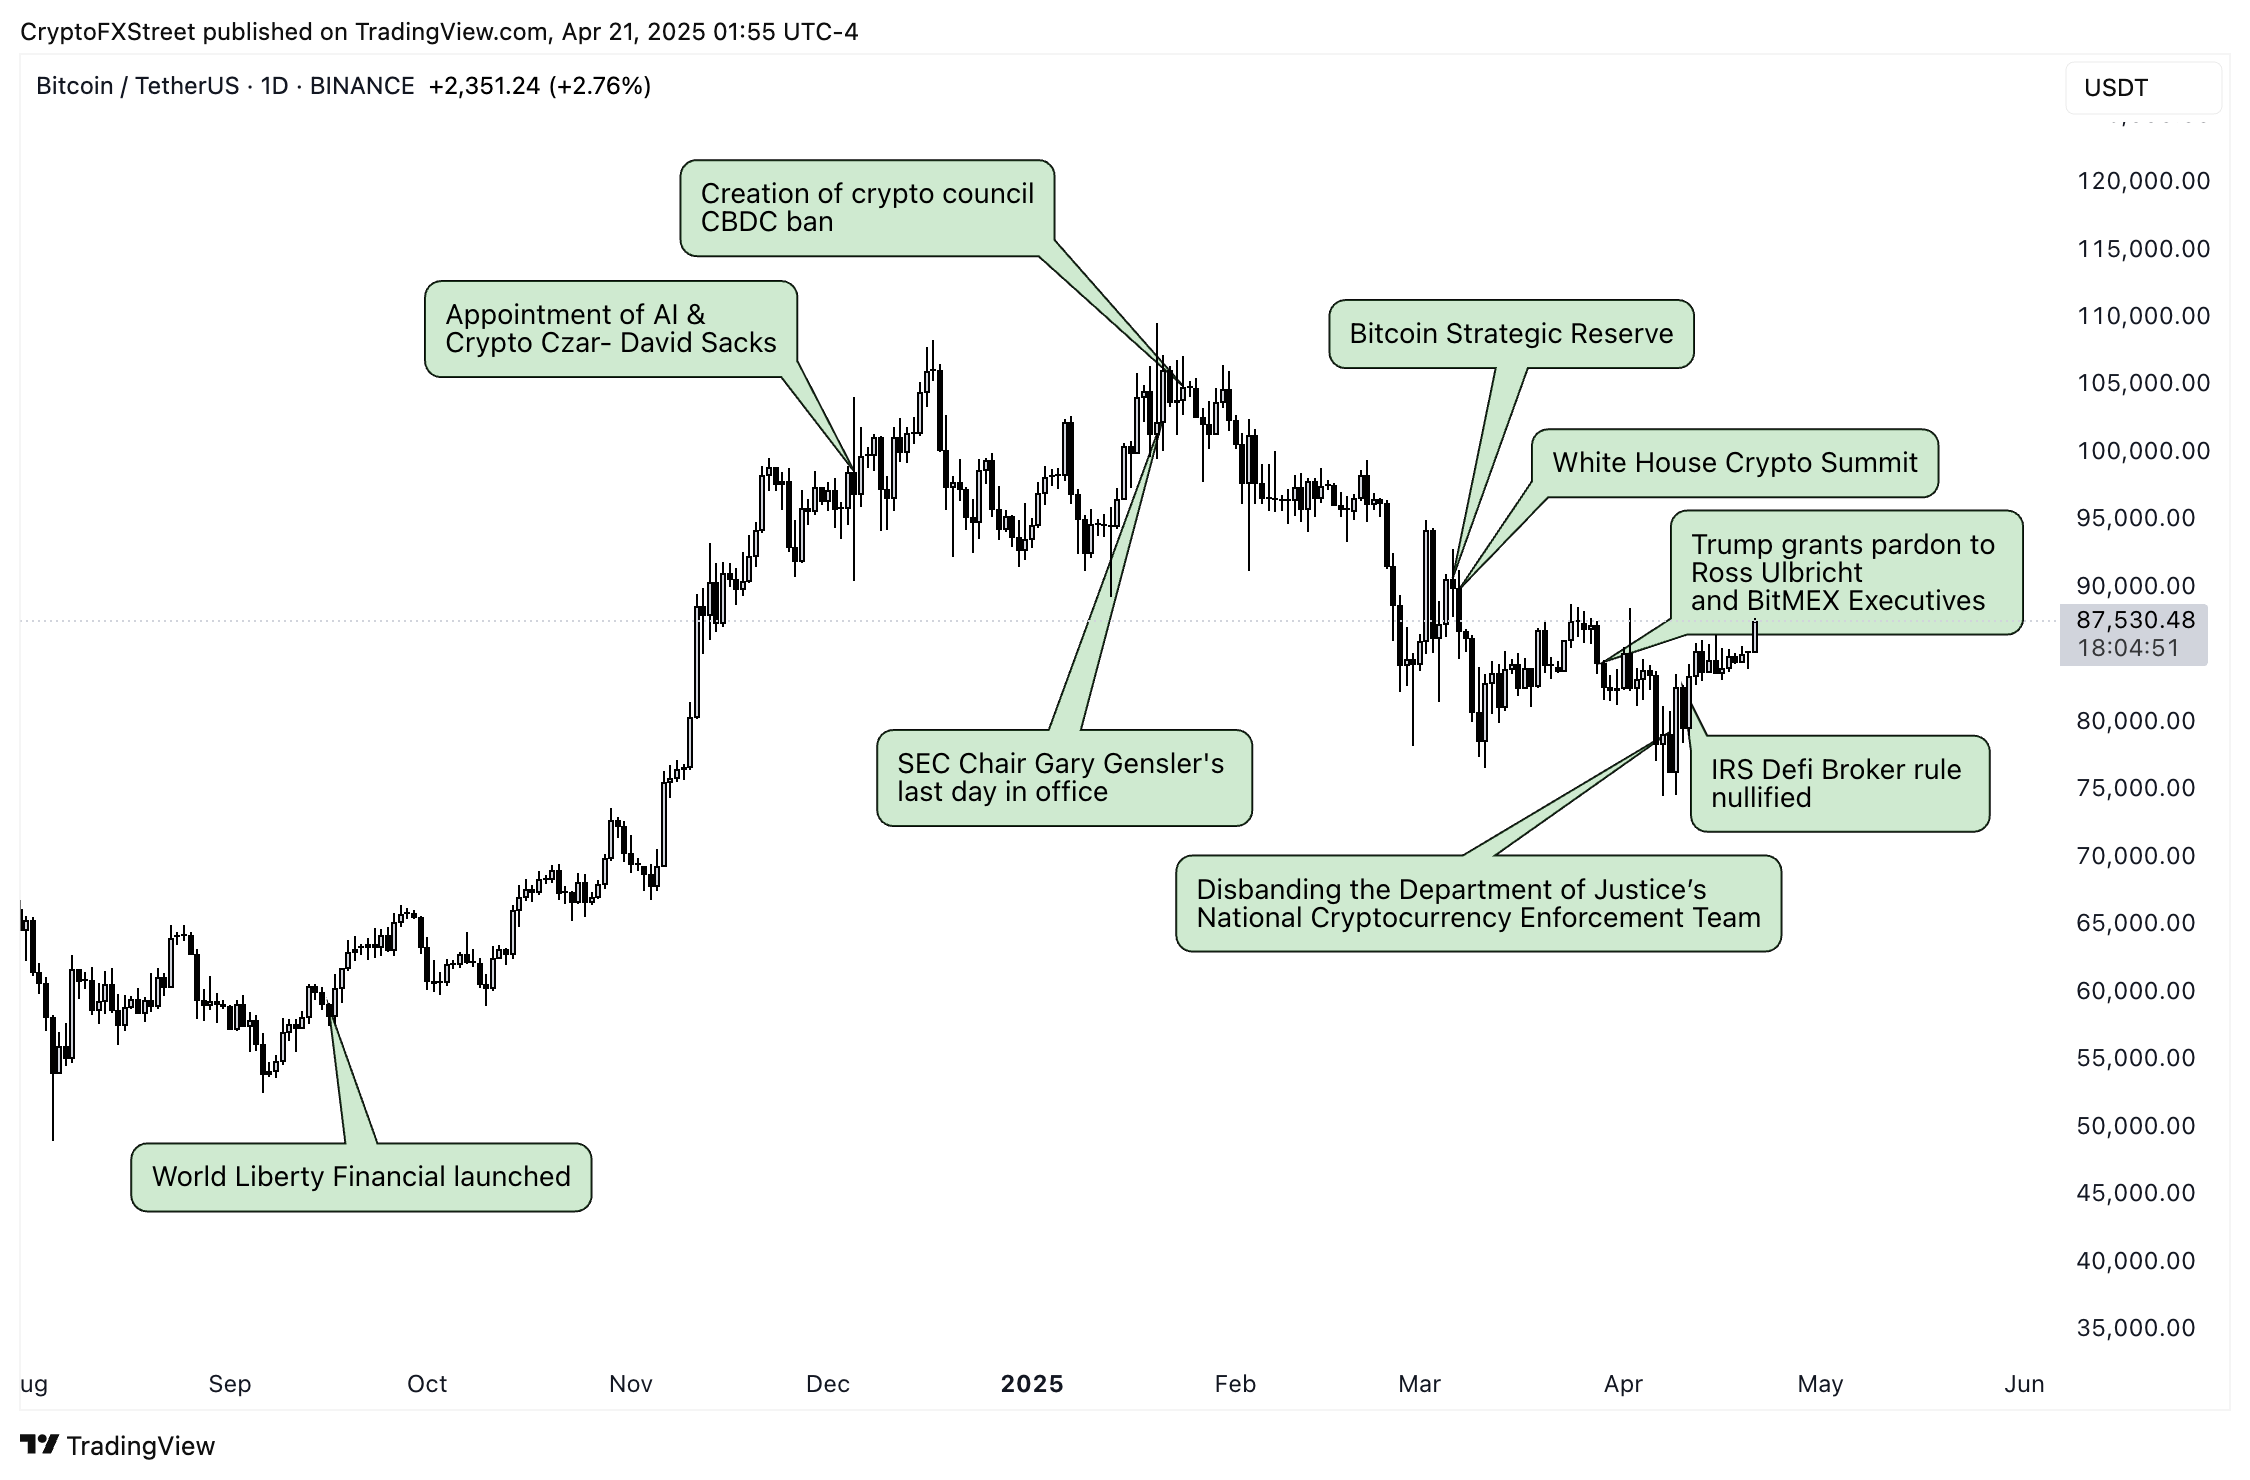
BTC/USDT daily price chart
Crypto market liquidations have surpassed $218 million in the last 24 hours. A closer look at exchange-specific liquidation data shows that bearish traders, the derivatives traders with short positions, are suffering heavy liquidations relative to bullish ones.
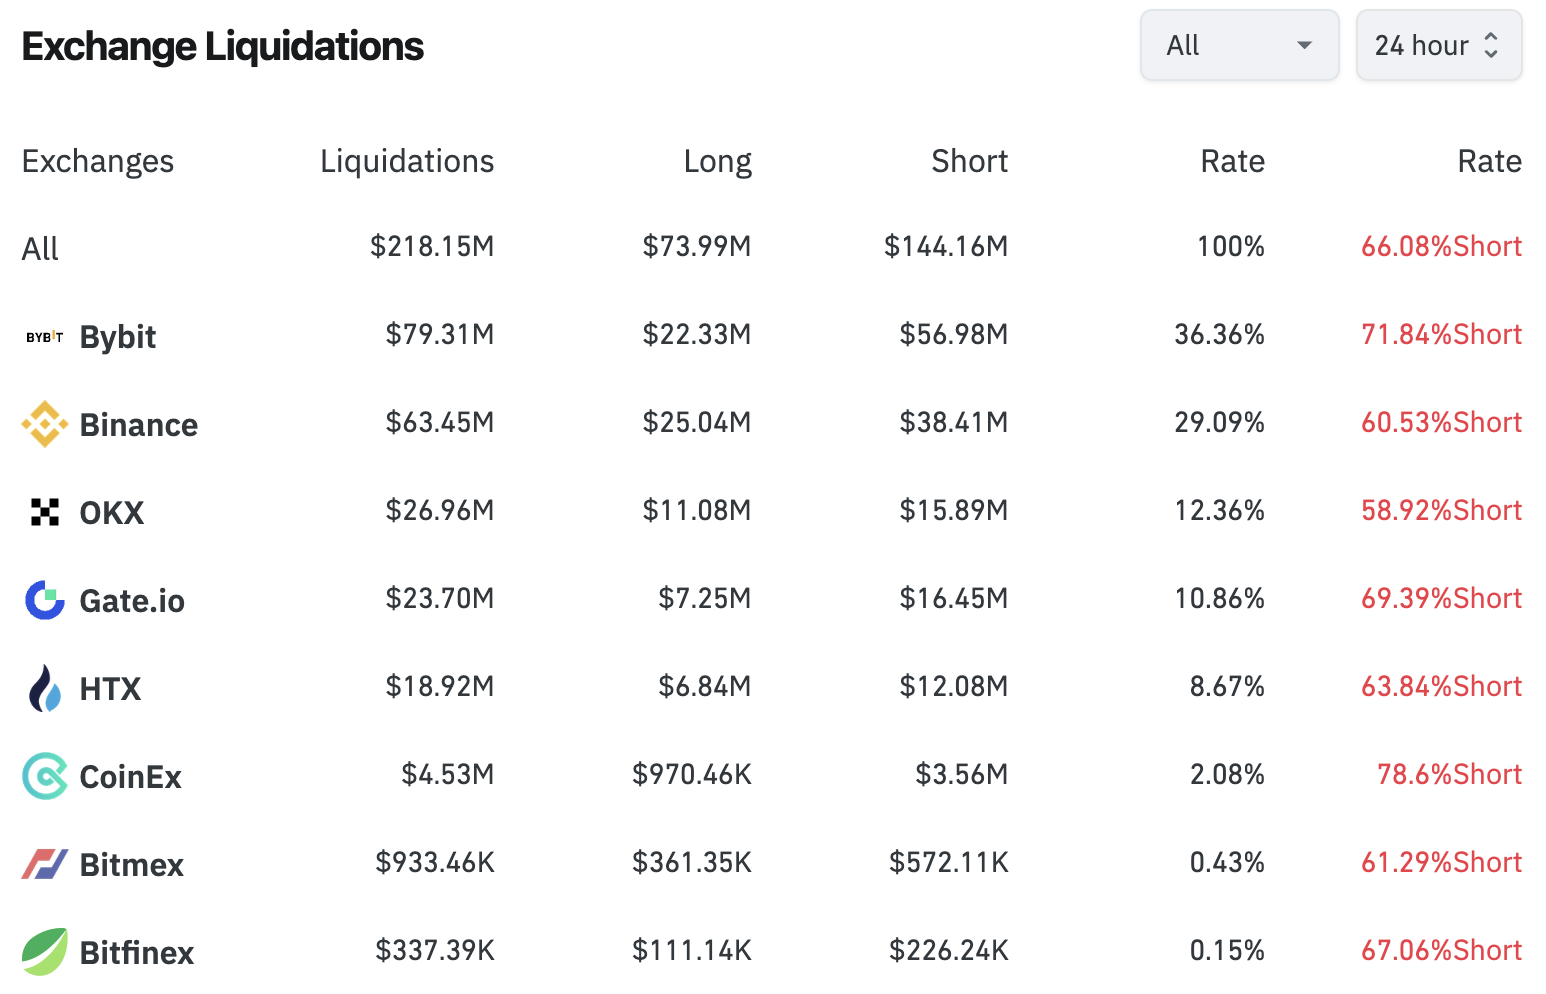
Exchange liquidations | Source: Coinglass
This could imply that the market is preparing for a breakout and shorts continue to pay for longs. However, this could change as it did in previous instances during this market cycle. To determine whether it is indeed a breakout and not another fakeout in the Bitcoin bull market, it is essential to look for confirmation of a break above key resistances.
Bitcoin faces sticky resistance at the $88,000 level, with BTC consolidating under this level in April. Meanwhile, Ethereum is ranging below the $1,800 level and XRP faces resistance at $2.20. A clean break above key resistance levels could confirm a breakout, among other factors.
Strong market movement, higher trade volume and participation from traders are other factors used to determine whether there is an actual breakout. As of Monday, market participation remains average, according to Coinglass data. The 24 hour change in volume measures participation from derivatives traders, for top 10 cryptos it shows a double-digit increase.
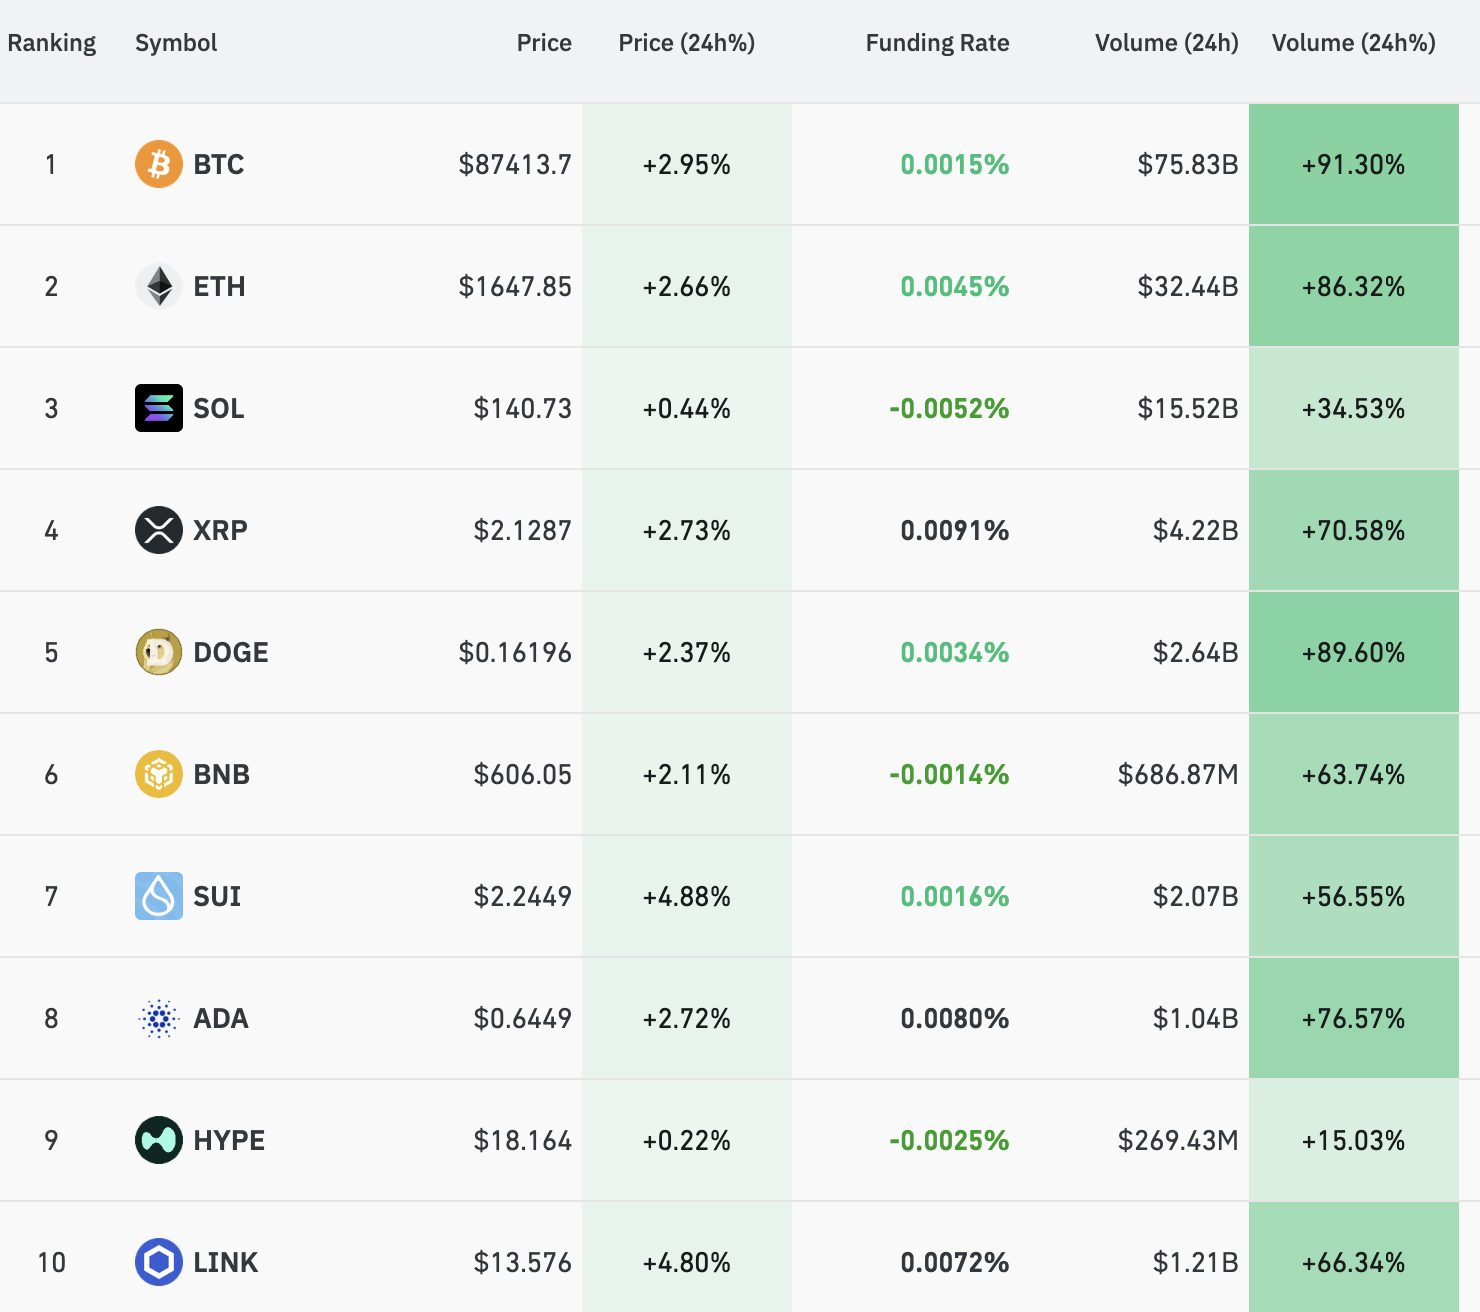
Volume change in derivatives in top 10 cryptos | Source: Coinglass
A positive change in the volume supports a thesis for continued recovery in the top 10 cryptos.


