
Texas is officially home to the most cities that are fast-growing and affordable enough for your money. The Lone Star State recently swept a new GOBankingRates study ranking the most affordable U.S. places that have large population growth, with 12 cities to rank out out of the top 50.
Find Out: What Is the Estimated Median Income for the Upper-Middle Class in 2025?
Try This: How Middle-Class Earners Are Quietly Becoming Millionaires — and How You Can, Too
For this study, GOBankingRates used qualifying cities with populations of 100,000, a 1-year and 5-year population growth larger than the national growth rate and average rental or mortgage costs lower than the national average. The U.S. Census American Community Survey from 2018, 2022 and 2023 helped source each city’s total population, total households and household median income, all of which were used to calculate the 1-year and 5-year population changes.

Key Findings
Frisco, Texas, is the nation’s most affordable, fastest-growing city. Within a five-year span, the population has increased by 26.9%. The annual cost of living is reasonable for both renters and homeowners, with renters paying $46,718 and homeowners $72,262 annually.
Frisco, Goodyear, McKinney, Fishers, Allen, Carmel, League City, Lewisville, Olathe and Round Rock ranked as the 10 fastest-growing and most affordable cities. More than half of these cities are based in Texas. The remaining states represented include Arizona, Indiana and Kansas.
Texas dominated the top 50 with 12 cities. These include Frisco (#1), McKinney (#3), Allen (#5), League City (#7), Lewisville (#8), Round Rock (#10), Pearland (#11), Denton (#19), Fort Worth (#26), Austin (#35), Edinburg (#43) and Killeen (#49).
Ranked in order from largest to smallest population change and most to least affordable are the 50 fastest-growing, most affordable cities in 2025.
See More: Here’s the Minimum Salary Required To Be Considered Upper-Middle Class in 2025
View Next: Salary Needed To Achieve the American Dream in the 50 Largest Cities
Trending Now: Suze Orman’s Secret to a Wealthy Retirement–Have You Made This Money Move?
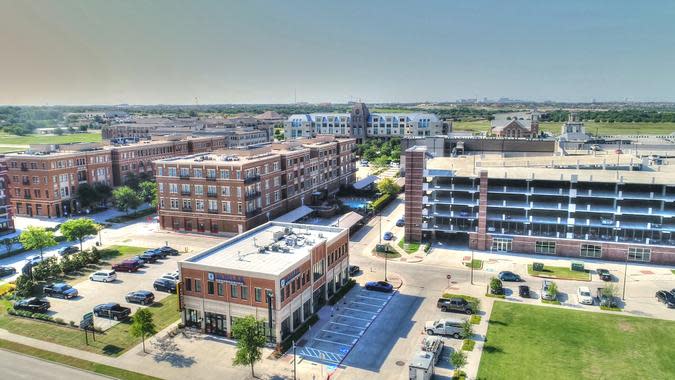
1. Frisco, Texas
5-year population growth: 26.9%
1-year population growth: 4%
Median household income: $146,158
Total cost of living for renter annually: $46,718
Total cost of living for homeowner annually: $72,262
Average home value: $678,435
Discover More: 9 Things the Middle Class Should Consider Downsizing To Save on Monthly Expenses
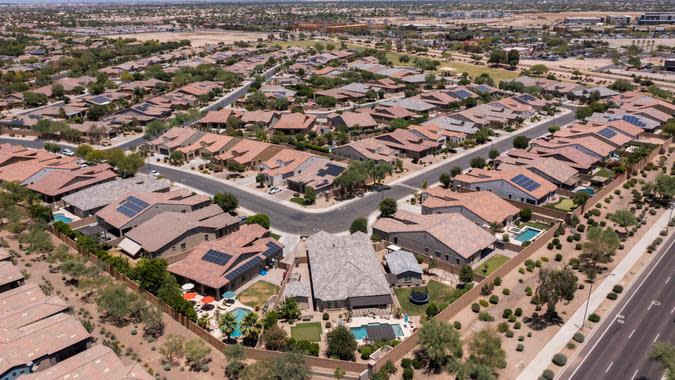
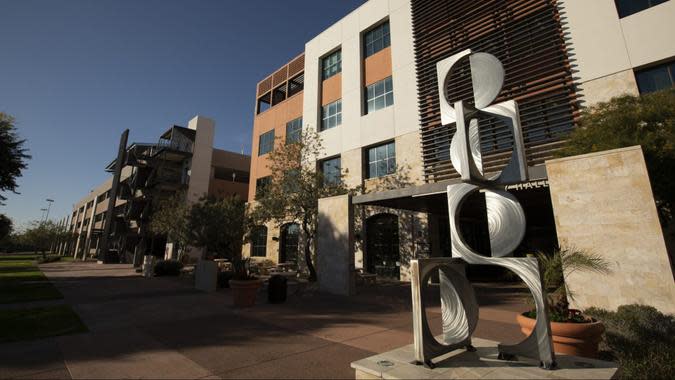
2. Goodyear, Arizona
5-year population growth: 32.8%
1-year population growth: 5.5%
Median household income: $101,814
Total cost of living for renter annually: $49,011
Total cost of living for homeowner annually: $58,494
Average home value: $478,276
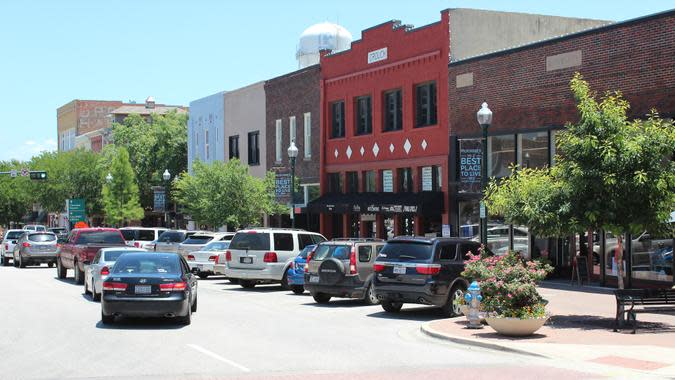
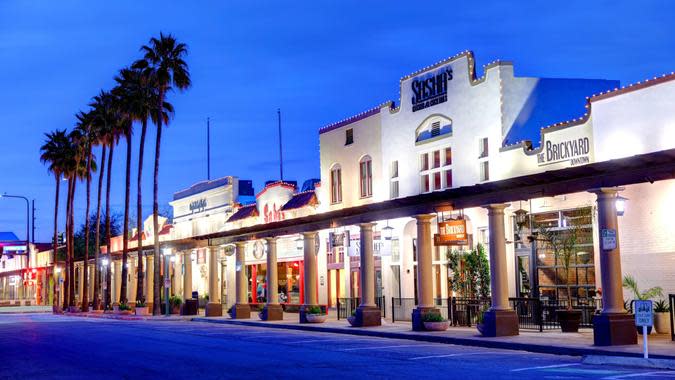
3. McKinney, Texas
5-year population growth: 16.6%
1-year population growth: 3.1%
Median household income: $120,273
Total cost of living for renter annually: $45,023
Total cost of living for homeowner annually: $58,907
Average home value: $512,667

4. Fishers, Indiana
5-year population growth: 13.8%
1-year population growth: 1.9%
Median household income: $128,141
Total cost of living for renter annually: $46,989
Total cost of living for homeowner annually: $54,414
Average home value: $438,966
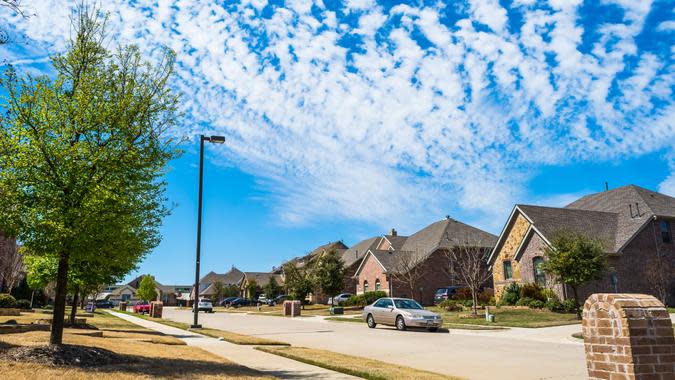
5. Allen, Texas
5-year population growth: 8.5%
1-year population growth: 2.1%
Median household income: $129,130
Total cost of living for renter annually: $44,456
Total cost of living for homeowner annually: $58,678
Average home value: $514,490

6. Carmel, Indiana
5-year population growth: 11.5%
1-year population growth: 1.1%
Median household income: $134,602
Total cost of living for renter annually: $46,507
Total cost of living for homeowner annually: $62,126
Average home value: $553,141
Be Aware: How Much You Need To Earn To Be Upper Middle Class in Every State
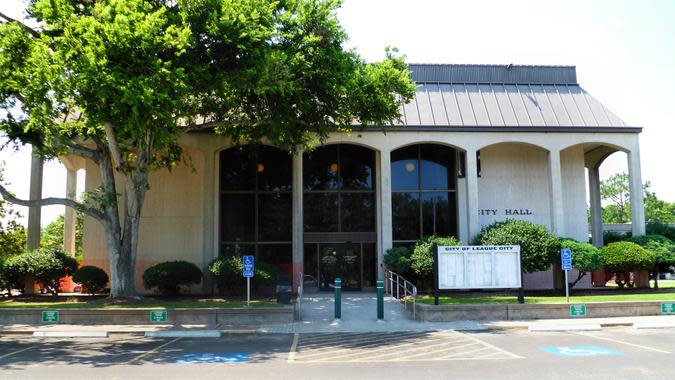
7. League City, Texas
5-year population growth: 13.9%
1-year population growth: 1.3%
Median household income: $119,870
Total cost of living for renter annually: $44,264
Total cost of living for homeowner annually: $47,459
Average home value: $369,058

8. Lewisville, Texas
5-year population growth: 22.5%
1-year population growth: 2.6%
Median household income: $85,002
Total cost of living for renter annually: $43,995
Total cost of living for homeowner annually: $53,007
Average home value: $404,946

9. Olathe, Kansas
5-year population growth: 5.7%
1-year population growth: 1.1%
Median household income: $112,232
Total cost of living for renter annually: $45,070
Total cost of living for homeowner annually: $51,825
Average home value: $401,785
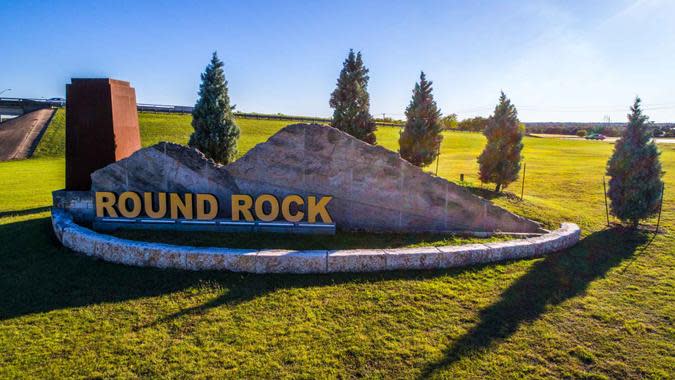
10. Round Rock, Texas
5-year population growth: 3.4%
1-year population growth: 3.2%
Median household income: $97,187
Total cost of living for renter annually: $42,390
Total cost of living for homeowner annually: $52,364
Average home value: $433,767
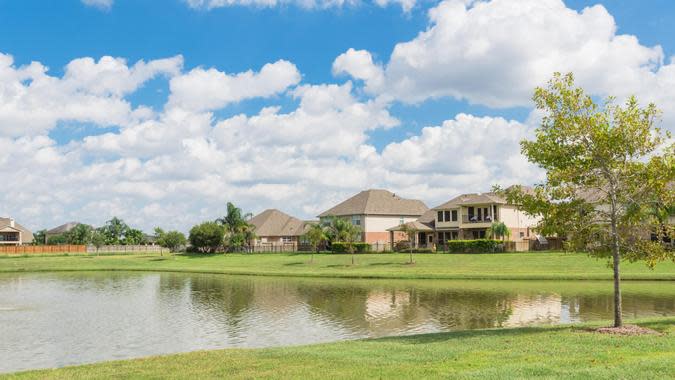
11. Pearland, Texas
5-year population growth: 6.9%
1-year population growth: 1.2%
Median household income: $112,470
Total cost of living for renter annually: $51,032
Total cost of living for homeowner annually: $54,241
Average home value: $376,350
For You: Here’s the Minimum Salary Required To Be Considered Upper Class in 2025

12. Nampa, Idaho
5-year population growth: 16%
1-year population growth: 3.6%
Median household income: $72,122
Total cost of living for renter annually: $40,684
Total cost of living for homeowner annually: $50,656
Average home value: $404,082

13. Murfreesboro, Tennessee
5-year population growth: 20.3%
1-year population growth: 2.7%
Median household income: $76,241
Total cost of living for renter annually: $45,275
Total cost of living for homeowner annually: $52,728
Average home value: $410,857

14. Peoria, Arizona
5-year population growth: 18.1%
1-year population growth: 1.6%
Median household income: $93,403
Total cost of living for renter annually: $50,490
Total cost of living for homeowner annually: $61,963
Average home value: $495,587
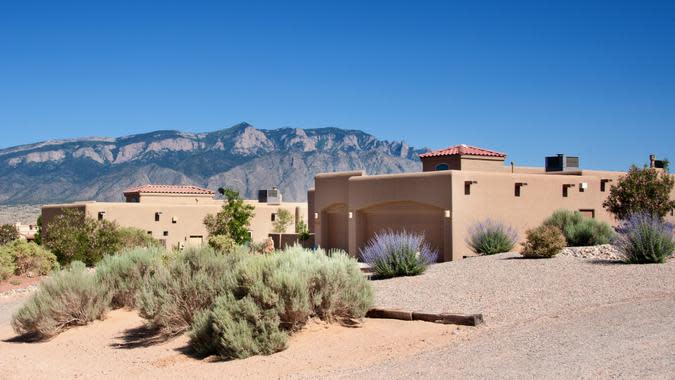
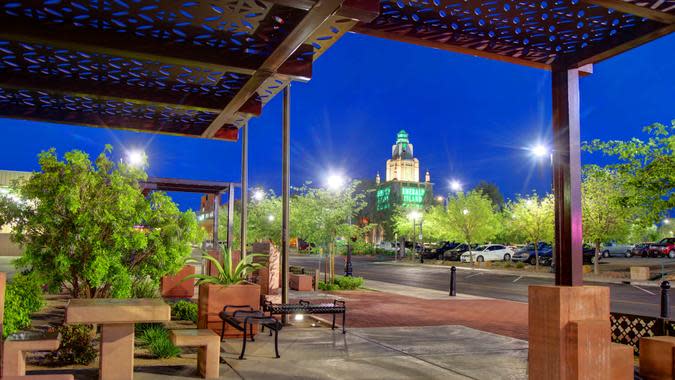
15. Rio Rancho, New Mexico
5-year population growth: 12.2%
1-year population growth: 2.1%
Median household income: $85,755
Total cost of living for renter annually: $45,823
Total cost of living for homeowner annually: $47,207
Average home value: $348,895
16. Surprise, Arizona
5-year population growth: 12.5%
1-year population growth: 2.7%
Median household income: $93,371
Total cost of living for renter annually: $56,465
Total cost of living for homeowner annually: $62,596
Average home value: $432,225
Explore More: Warren Buffett’s Top 4 Tips for Getting Richer

17. Concord, North Carolina
5-year population growth: 18.7%
1-year population growth: 1.1%
Median household income: $84,752
Total cost of living for renter annually: $45,267
Total cost of living for homeowner annually: $49,274
Average home value: $376,098
18. Chandler, Arizona
5-year population growth: 11.9%
1-year population growth: 0.9%
Median household income: $103,691
Total cost of living for renter annually: $47,908
Total cost of living for homeowner annually: $61,788
Average home value: $536,681

19. Denton, Texas
5-year population growth: 10%
1-year population growth: 3.3%
Median household income: $73,719
Total cost of living for renter annually: $41,775
Total cost of living for homeowner annually: $47,235
Average home value: $362,723
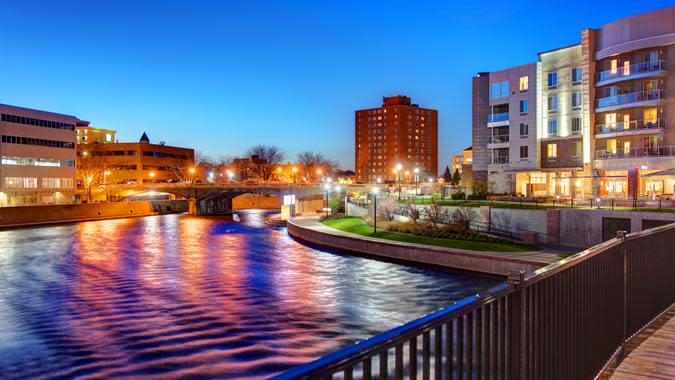
20. Sioux Falls, South Dakota
5-year population growth: 13.5%
1-year population growth: 2.2%
Median household income: $74,714
Total cost of living for renter annually: $36,600
Total cost of living for homeowner annually: $45,244
Average home value: $324,217

21. Palm Bay, Florida
5-year population growth: 13.6%
1-year population growth: 3.1%
Median household income: $67,521
Total cost of living for renter annually: $46,481
Total cost of living for homeowner annually: $45,092
Average home value: $308,797
Find Out: What Salary Single People Need To Live Comfortably in 100 Major US Cities
22. Henderson, Nevada
5-year population growth: 11.4%
1-year population growth: 2%
Median household income: $88,654
Total cost of living for renter annually: $47,942
Total cost of living for homeowner annually: $61,049
Average home value: $507,401
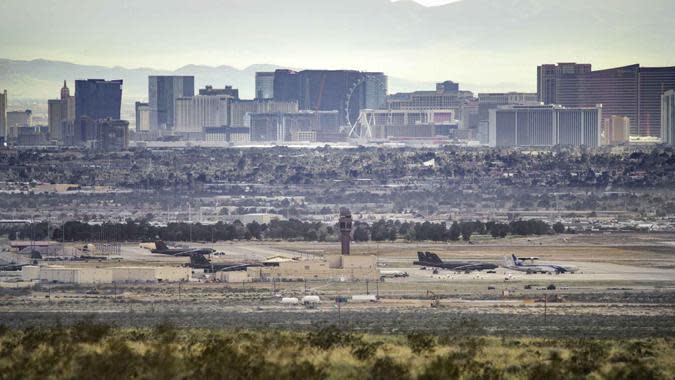
23. North Las Vegas, Nevada
5-year population growth: 14.3%
1-year population growth: 2.6%
Median household income: $76,772
Total cost of living for renter annually: $49,408
Total cost of living for homeowner annually: $54,869
Average home value: $411,605
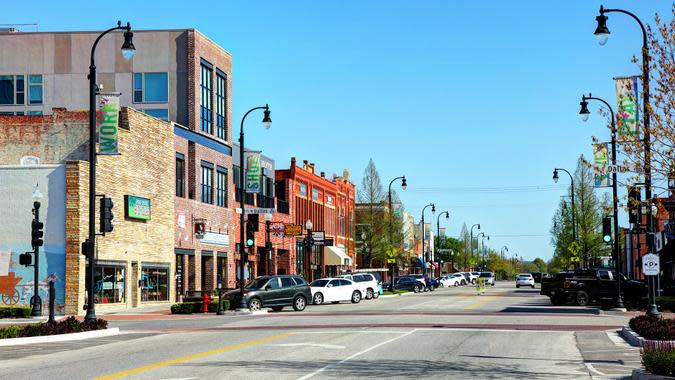
24. Broken Arrow, Oklahoma
5-year population growth: 7.8%
1-year population growth: 1.5%
Total cost of living for renter annually: $44,169
Total cost of living for homeowner annually: $43,043
Average home value: $275,440
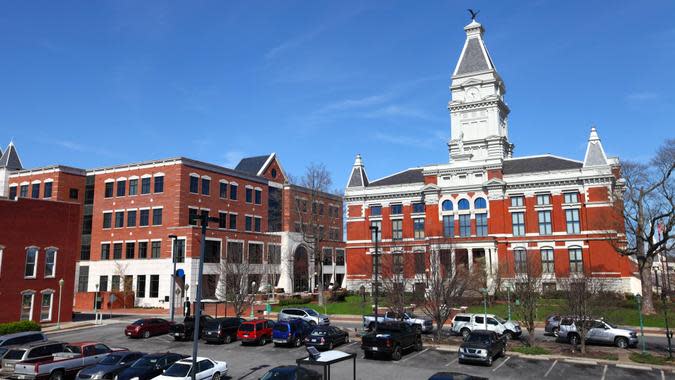
25. Clarksville, Tennessee
5-year population growth: 14.1%
1-year population growth: 2.4%
Median household income: $66,786
Total cost of living for renter annually: $40,016
Total cost of living for homeowner annually: $44,383
Average home value: $305,125
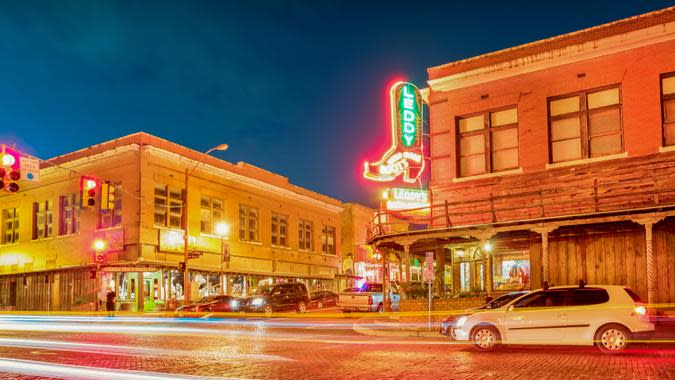
26. Fort Worth, Texas
5-year population growth: 10%
1-year population growth: 1.8%
Median household income: $76,602
Total cost of living for renter annually: $42,209
Total cost of living for homeowner annually: $42,844
Average home value: $300,115
For You: The Living Wage a Family of 4 Needs in All 50 States
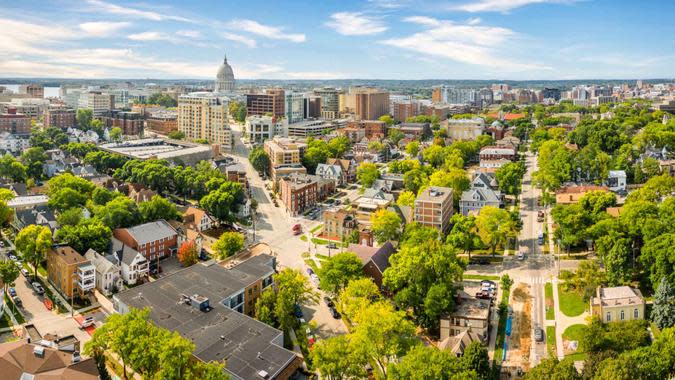
27. Madison, Wisconsin
5-year population growth: 9.3%
1-year population growth: 2.6%
Median household income: $76,983
Total cost of living for renter annually: $43,320
Total cost of living for homeowner annually: $53,633
Average home value: $431,553

28. Huntsville, Alabama
5-year population growth: 13%
1-year population growth: 1.8%
Median household income: $70,778
Total cost of living for renter annually: $40,409
Total cost of living for homeowner annually: $42,970
Average home value: $272,010

29. Thornton, Colorado
5-year population growth: 6.2%
1-year population growth: 0.8%
Median household income: $100,985
Total cost of living for renter annually: $48,639
Total cost of living for homeowner annually: $62,450
Average home value: $540,519

30. Rochester, Minnesota
5-year population growth: 6.8%
1-year population growth: 0.7%
Median household income: $87,767
Total cost of living for renter annually: $41,894
Total cost of living for homeowner annually: $45,420
Average home value: $330,550

31. Durham, North Carolina
5-year population growth: 9.1%
1-year population growth: 1.5%
Median household income: $79,234
Total cost of living for renter annually: $43,122
Total cost of living for homeowner annually: $51,307
Average home value: $403,006
Read More: What Is the Estimated Median Income for the Upper-Middle Class in 2025?

32. Chesapeake, Virginia
5-year population growth: 5.6%
1-year population growth: 0.7%
Median household income: $94,189
Total cost of living for renter annually: $47,760
Total cost of living for homeowner annually: $53,807
Average home value: $414,816

33. Sparks, Nevada
5-year population growth: 10.7%
1-year population growth: 1%
Median household income: $86,979
Total cost of living for renter annually: $47,287
Total cost of living for homeowner annually: $59,907
Average home value: $517,816

34. Spokane Valley, Washington
5-year population growth: 9.8%
1-year population growth: 1.6%
Median household income: $70,722
Total cost of living for renter annually: $40,917
Total cost of living for homeowner annually: $50,280
Average home value: $403,655
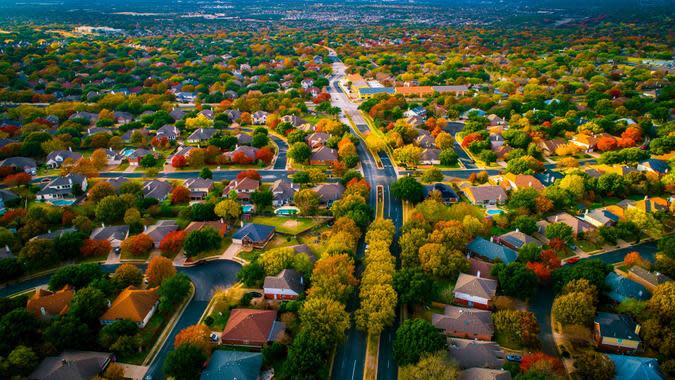
35. Austin, Texas
5-year population growth: 3.4%
1-year population growth: 1%
Median household income: $91,461
Total cost of living for renter annually: $44,044
Total cost of living for homeowner annually: $61,838
Average home value: $542,887

36. Reno, Nevada
5-year population growth: 10.9%
1-year population growth: 1.4%
Median household income: $78,448
Total cost of living for renter annually: $46,609
Total cost of living for homeowner annually: $63,108
Average home value: $567,613
Trending Now: Warren Buffett Offers One Piece of Estate Planning Advice to the Middle Class
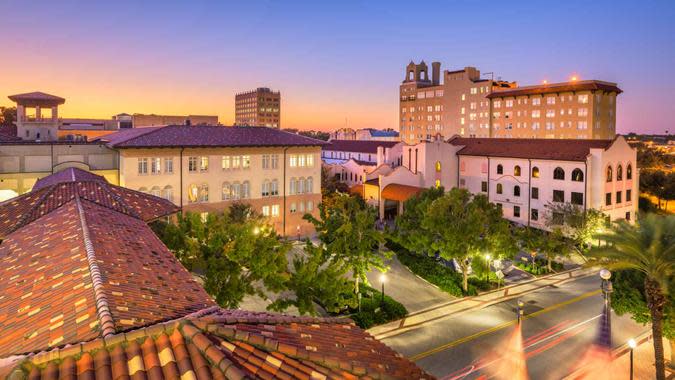
37. Lakeland, Florida
5-year population growth: 10.5%
1-year population growth: 2.3%
Median household income: $60,947
Total cost of living for renter annually: $45,135
Total cost of living for homeowner annually: $45,353
Average home value: $316,979
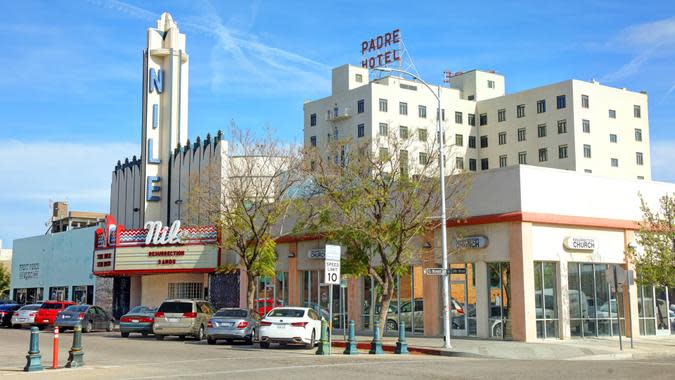
38. Bakersfield, California
5-year population growth: 8.7%
1-year population growth: 1%
Median household income: $77,397
Total cost of living for renter annually: $46,344
Total cost of living for homeowner annually: $50,573
Average home value: $394,348

39. Oklahoma City
5-year population growth: 8.1%
1-year population growth: 1.1%
Median household income: $66,702
Total cost of living for renter annually: $39,567
Total cost of living for homeowner annually: $38,032
Average home value: $200,498

40. Visalia, California
5-year population growth: 8.8%
1-year population growth: 0.8%
Median household income: $79,952
Total cost of living for renter annually: $49,530
Total cost of living for homeowner annually: $53,219
Average home value: $388,842

41. Fargo, North Dakota
5-year population growth: 7.4%
1-year population growth: 1.4%
Median household income: $66,029
Total cost of living for renter annually: $34,968
Total cost of living for homeowner annually: $44,032
Average home value: $311,759
Learn More: 10 Things the Middle Class Won’t Be Able To Afford in Less Than a Decade
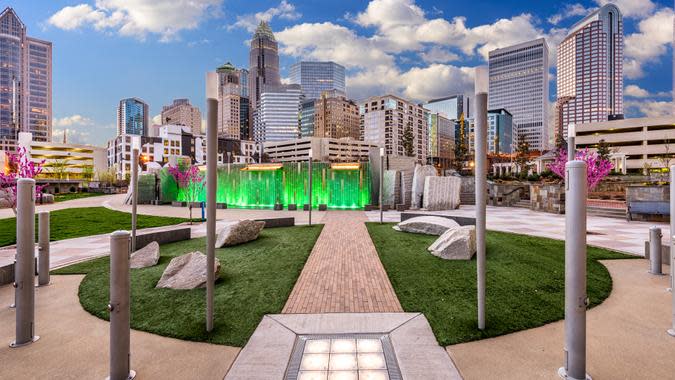
42. Charlotte, North Carolina
5-year population growth: 5.3%
1-year population growth: 1.3%
Median household income: $78,438
Total cost of living for renter annually: $45,278
Total cost of living for homeowner annually: $51,963
Average home value: $403,178
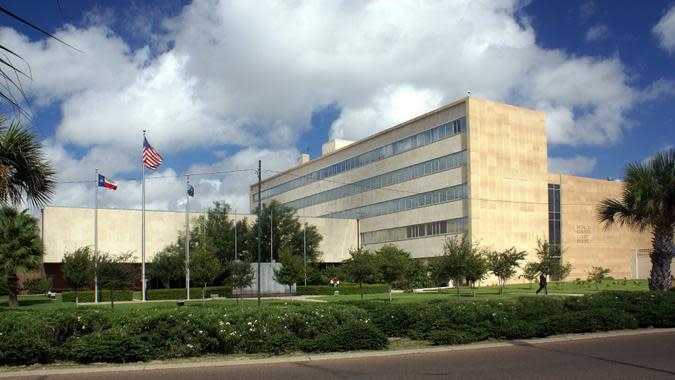
43. Edinburg, Texas
5-year population growth: 9.1%
1-year population growth: 1.6%
Median household income: $57,789
Total cost of living for renter annually: $35,277
Total cost of living for homeowner annually: $37,536
Average home value: $210,010
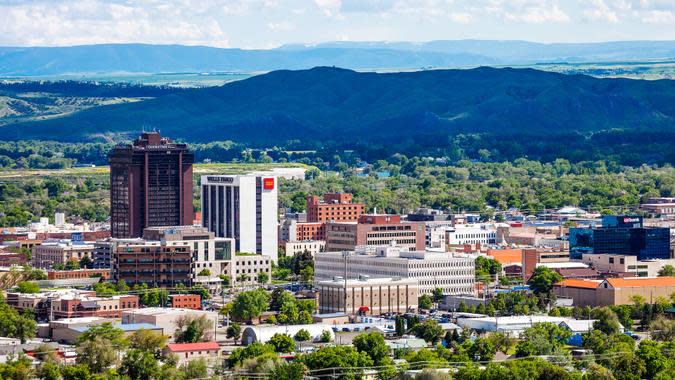
44. Billings, Montana
5-year population growth: 8.1%
1-year population growth: 1.1%
Median household income: $71,855
Total cost of living for renter annually: $39,048
Total cost of living for homeowner annually: $49,495
Average home value: $389,820
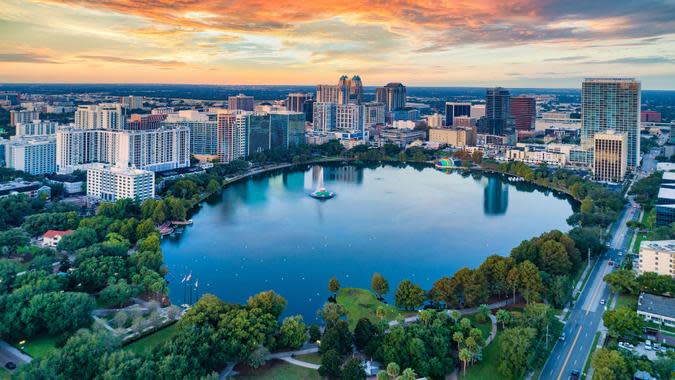
45. Orlando, Florida
5-year population growth: 13.1%
1-year population growth: 1.3%
Median household income: $69,268
Total cost of living for renter annually: $48,930
Total cost of living for homeowner annually: $53,784
Average home value: $406,930
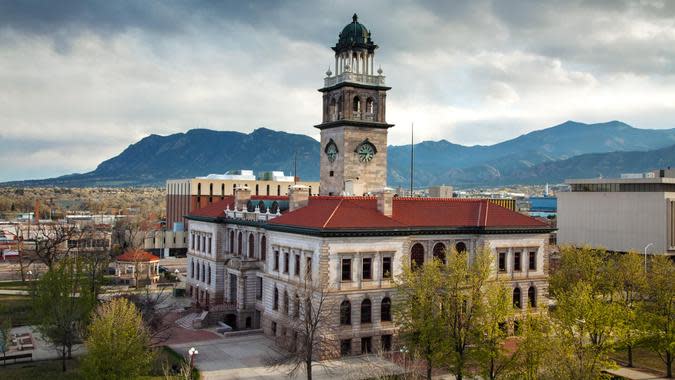
46. Colorado Springs, Colorado
5-year population growth: 5.6%
1-year population growth: 0.7%
Median household income: $83,198
Total cost of living for renter annually: $44,411
Total cost of living for homeowner annually: $54,908
Average home value: $460,117
Discover Next: 20 Best Cities Where You Can Buy a House for Under $100K
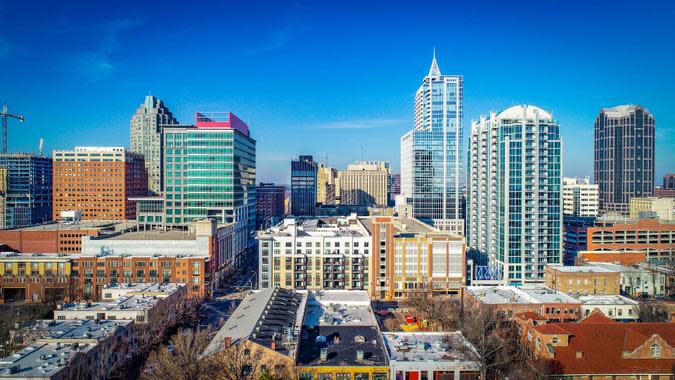
47. Raleigh, North Carolina
5-year population growth: 3%
1-year population growth: 1.1%
Median household income: $82,424
Total cost of living for renter annually: $43,532
Total cost of living for homeowner annually: $54,289
Average home value: $443,947
48. Aurora, Colorado
5-year population growth: 7.3%
1-year population growth: 0.7%
Median household income: $84,320
Total cost of living for renter annually: $46,855
Total cost of living for homeowner annually: $60,213
Average home value: $502,568
49. Killeen, Texas
5-year population growth: 9.1%
1-year population growth: 1.6%
Median household income: $58,339
Total cost of living for renter annually: $38,975
Total cost of living for homeowner annually: $38,618
Average home value: $217,761
50. Jacksonville, Florida
5-year population growth: 9.4%
1-year population growth: 1.2%
Median household income: $66,981
Total cost of living for renter annually: $44,087
Total cost of living for homeowner annually: $45,414
Average home value: $298,418
Methodology: For this study, GOBankingRates analyzed U.S. cities to find the most affordable places with large population growth. Using the Census American Community surveys from 2018, 2022 and 2023, the total population, total households and household median income were all sourced and used to calculate the [1] 1-year and [2] 5-year population changes. To qualify for this study, the city had to have a total population of at least 100,000, a 1-year and 5-year population growth larger than the national growth rate from the same time period and an average rental cost or average mortgage cost lower than the national average. Relevant data was sourced from Zillow Observed Rental Index and Zillow Home Value Index, Federal Reserve Economic Data, Sperling’s BestPlaces and the Bureau of Labor Statistics Consumer Expenditure Survey. Using the median household income and the total cost of living for homeowners and total cost of living for renters was used to calculate the [3] leftover savings for homeowners and [4] leftover savings for renters. [1] The 1-year population change, [2] 5-year population change, [3] leftover savings for homeowners, and [4] leftover savings for renters were all scored and sorted. All data was collected on and is up to date as of April 15, 2025.
More From GOBankingRates
6 Costco Products That Have the Most Customer Complaints
Mark Cuban Warns of ‘Red Rural Recession’ — 4 States That Could Get Hit Hard
How Middle-Class Earners Are Quietly Becoming Millionaires — and How You Can, Too
4 Low-Risk Ways To Build Your Savings in 2025
This article originally appeared on GOBankingRates.com: 50 Most Affordable, Fastest-Growing Cities in 2025


