
Retirement should be a time of leisure and relaxation, but you won’t be doing too much relaxing in the shade if you’re constantly stressing about money. Most people retire on a limited budget, which means seeking new places to live where you can stretch your money further.
Learn More: How Far $750,000 in Retirement Savings Plus Social Security Goes in Every State
Check Out: 5 Unusual Ways To Make Extra Money That Actually Work
To pinpoint the cheapest places to retire, GOBankingRates analyzed and ranked the 100 biggest U.S. cities based on the annual retirement income needed to cover basic costs, including housing, healthcare, groceries, transportation and utilities.
We also rated cities based on their livability, and considered only cities where the percentage of senior population was 10% or higher.
Take a look and see why these are the places where you don’t need to be a millionaire to retire.

50. Richmond, Virginia
-
Monthly expenditures: $1,858
-
Percent of population age 65 and older: 13.6%
-
Livability score: 84
Also See: How Long $1 Million in Retirement Will Last in Every State
Discover More: Here’s the Cost of Living in Every State
Trending Now: Suze Orman’s Secret to a Wealthy Retirement–Have You Made This Money Move?

49. Macon, Georgia
-
Monthly expenditures: $1,857
-
Percent of population age 65 and older: 16.2%
-
Livability score: 75
Explore More: Here’s How Much You Need To Earn To Be ‘Rich’ in Every State

48. Lubbock, Texas
-
Monthly expenditures: $1,856
-
Percent of population age 65 and older: 12.5%
-
Livability score: 78

47. Kansas City, Kansas
-
Monthly expenditures: $1,856
-
Percent of population age 65 and older: 13.0%
-
Livability score: 75

46. Tulsa, Oklahoma
-
Monthly expenditures: $1,854
-
Percent of population age 65 and older: 15.0%
-
Livability score: 75

45. Madison, Wisconsin
-
Monthly expenditures: $1,853
-
Percent of population age 65 and older: 12.7%
-
Livability score: 82

44. Reno, Nevada
-
Monthly expenditures: $1,852
-
Percent of population age 65 and older: 16.3%
-
Livability score: 81
Find Out: 10 Things Boomers Should Always Buy in Retirement

43. Louisville, Kentucky
-
Monthly expenditures: $1,839
-
Percent of population age 65 and older: 15.9%
-
Livability score: 66

42. Durham, North Carolina
-
Monthly expenditures: $1,837
-
Percent of population age 65 and older: 13.0%
-
Livability score: 82

41. Raleigh, North Carolina
-
Monthly expenditures: $1,837
-
Percent of population age 65 and older: 11.7%
-
Livability score: 84

40. Cary, North Carolina
-
Monthly expenditures: $1,834
-
Percent of population age 65 and older: 13.9%
-
Livability score: 90

39. Aurora, Illinois
-
Monthly expenditures: $1,834
-
Percent of population age 65 and older: 10.5%
-
Livability score: 71
Read More: How Far $500,000 in Retirement Savings Plus Social Security Goes in Every State

38. Corpus Christi, Texas
-
Monthly expenditures: $1,833
-
Percent of population age 65 and older: 15.0%
-
Livability score: 80

37. San Antonio
-
Monthly expenditures: $1,826
-
Percent of population age 65 and older: 13.1%
-
Livability score: 80

36. Augusta, Georgia
-
Monthly expenditures: $1,826
-
Percent of population age 65 and older: 14.8%
-
Livability score: 64

35. Memphis, Tennessee
-
Monthly expenditures: $1,825
-
Percent of population age 65 and older: 14.1%
-
Livability score: 70

34. Minneapolis
-
Monthly expenditures: $1,823
-
Percent of population age 65 and older: 10.8%
-
Livability score: 78
Read Next: The Money You Need To Save Monthly To Retire Comfortably in Every State

33. Tacoma, Washington
-
Monthly expenditures: $1,819
-
Percent of population age 65 and older: 14.6%
-
Livability score: 78

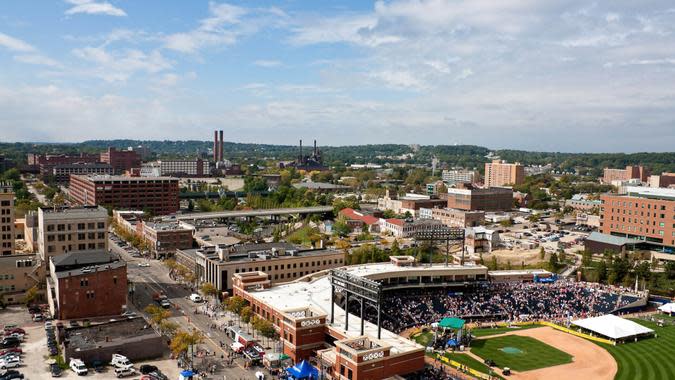
32. St. Louis
-
Monthly expenditures: $1,818
-
Percent of population age 65 and older: 14.9%
-
Livability score: 74

31. Columbus, Georgia
-
Monthly expenditures: $1,818
-
Percent of population age 65 and older: 14.4%
-
Livability score: 64

30. St. Paul, Minnesota
-
Monthly expenditures: $1,815
-
Percent of population age 65 and older: 12.2%
-
Livability score: 80

29. Indianapolis
-
Monthly expenditures: $1,815
-
Percent of population age 65 and older: 12.9%
-
Livability score: 76
For You: Cutting Expenses for Retirement? Here’s the No. 1 Thing To Get Rid of First

28. Lexington, Kentucky
-
Monthly expenditures: $1,813
-
Percent of population age 65 and older: 14.4%
-
Livability score: 87

27. Columbus, Ohio
-
Monthly expenditures: $1,809
-
Percent of population age 65 and older: 11.0%
-
Livability score: 81

26. Sioux Falls, South Dakota
-
Monthly expenditures: $1,809
-
Percent of population age 65 and older: 13.7%
-
Livability score: 85

25. Chattanooga, Tennessee
-
Monthly expenditures: $1,807
-
Percent of population age 65 and older: 17.2%
-
Livability score: 76

24. Cincinnati
-
Monthly expenditures: $1,804
-
Percent of population age 65 and older: 13.2%
-
Livability score: 80
Trending Now: 5 Southern States Where $750,000 in Retirement Savings Lasts Longest
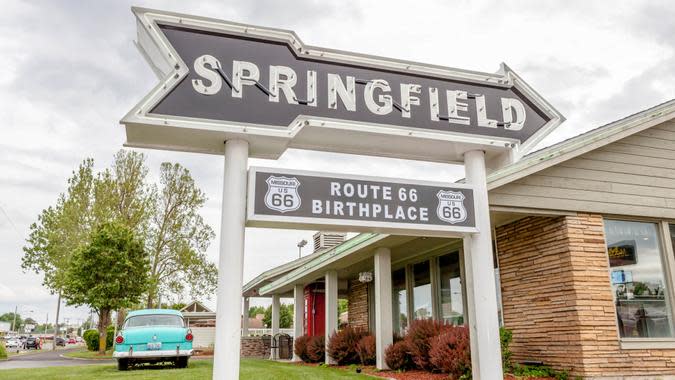
23. Springfield, Missouri
-
Monthly expenditures: $1,802
-
Percent of population age 65 and older: 15.8%
-
Livability score: 72

22. Fort Collins, Colorado
-
Monthly expenditures: $1,795
-
Percent of population age 65 and older: 12.2%
-
Livability score: 81

21. El Paso, Texas
-
Monthly expenditures: $1,794
-
Percent of population age 65 and older: 13.9%
-
Livability score: 81

20. Knoxville, Tennessee
-
Monthly expenditures: $1,794
-
Percent of population age 65 and older: 14.5%
-
Livability score: 73

19. Eugene, Oregon
-
Monthly expenditures: $1,794
-
Percent of population age 65 and older: 17.7%
-
Livability score: 78
See More: 50 Cheapest Places To Retire Across America

18. Boise, Idaho
-
Monthly expenditures: $1,784
-
Percent of population age 65 and older: 15.3%
-
Livability score: 83

17. Des Moines, Iowa
-
Monthly expenditures: $1,783
-
Percent of population age 65 and older: 12.5%
-
Livability score: 83

16. Tucson, Arizona
-
Monthly expenditures: $1,776
-
Percent of population age 65 and older: 15.8%
-
Livability score: 73

15. Shreveport, Louisiana
-
Monthly expenditures: $1,776
-
Percent of population age 65 and older: 17.4%
-
Livability score: 60

14. Salem, Oregon
-
Monthly expenditures: $1,775
-
Percent of population age 65 and older: 15.3%
-
Livability score: 79

13. Colorado Springs
-
Monthly expenditures: $1,768
-
Percent of population age 65 and older: 14.7%
-
Livability score: 79
Check Out: America’s 50 Most Expensive Retirement Towns

12. Winston-Salem, North Carolina
-
Monthly expenditures: $1,765
-
Percent of population age 65 and older: 14.8%
-
Livability score: 63

11. Brownsville, Texas
-
Monthly expenditures: $1,754
-
Percent of population age 65 and older: 12.6%
-
Livability score: 79

10. Little Rock, Arkansas
-
Monthly expenditures: $1,745
-
Percent of population age 65 and older: 15.2%
-
Livability score: 72

9. Grand Rapids, Michigan
-
Monthly expenditures: $1,745
-
Percent of population age 65 and older: 12.9%
-
Livability score: 83

8. Amarillo, Texas
-
Monthly expenditures: $1,745
-
Percent of population age 65 and older: 14.8%
-
Livability score: 66
Learn More: The New Retirement Problem Boomers Are Facing

7. Greensboro, North Carolina
-
Monthly expenditures: $1,742
-
Percent of population age 65 and older: 13.9%
-
Livability score: 83

6. Fort Wayne, Indiana
-
Monthly expenditures: $1,741
-
Percent of population age 65 and older: 14.9%
-
Livability score: 84

5. Toledo, Ohio
-
Monthly expenditures: $1,738
-
Percent of population age 65 and older: 15.5%
-
Livability score: 66

4. Cleveland
-
Monthly expenditures: $1,723
-
Percent of population age 65 and older: 15%
-
Livability score: 72

3. Spokane, Washington
-
Monthly expenditures: $1,711
-
Percent of population age 65 and older: 16.4%
-
Livability score: 81

2. Albuquerque, New Mexico
-
Monthly expenditures: $1,710
-
Percent of population age 65 and older: 17.2%
-
Livability score: 72
1. Akron, Ohio
-
Monthly expenditures: $1,699
-
Percent of population age 65 and older: 15.7%
-
Livability score: 81
Methodology: For this study, GOBankingRates analyzed U.S. cities to find the cheapest places to retire. GOBankingRates identified cities with a population of at least 150,000 and a population percentage of residents aged 65 and over of at least 10%. For each location, GOBankingRates found total population, population ages 65 and over, total households and household median income, all sourced from the U.S. Census American Community Survey. Using this data, the percentage of the population ages 65 and over was calculated. The cost-of-living indexes were sourced from Sperling’s BestPlaces and include the grocery, healthcare, housing, utilities, transportation and miscellaneous cost-of-living indexes. Using the indexes and the national average expenditure costs for retired households, as sourced from the Bureau of Labor Statistics Consumer Expenditure Survey for retired households, the average expenditure cost for each location was calculated. The livability index was sourced from AreaVibes for each location and included as supplemental information to help determine the quality of life. The average single-family home value was sourced from Zillow Home Value Index for December 2024. Using the average home value, assuming a 10% down payment, and using the most recent national average 30-year fixed mortgage rate, as sourced from the Federal Reserve Economic Data, the average mortgage was calculated. Using the average mortgage and average expenditure costs, the average cost of living was calculated. The cities were sorted to show the cheapest total cost of living as well as the cheapest total expenditure costs. All data was collected on and is up to date as of Feb. 18, 2025.
More From GOBankingRates
-
I’m a Realtor: This Is Why No One Wants To See Your Home
-
3 Things Retirees Should Stop Buying To Save Money Amid Tariffs
-
How Middle-Class Earners Are Quietly Becoming Millionaires — and How You Can, Too
-
7 Wealth-Building Shortcuts Proven To Add $1K to Your Wallet This Month
This article originally appeared on GOBankingRates.com: 50 Cheapest Places To Retire Across America


 first to boost my Social Security checks a shrewd move or boneheaded choice?")